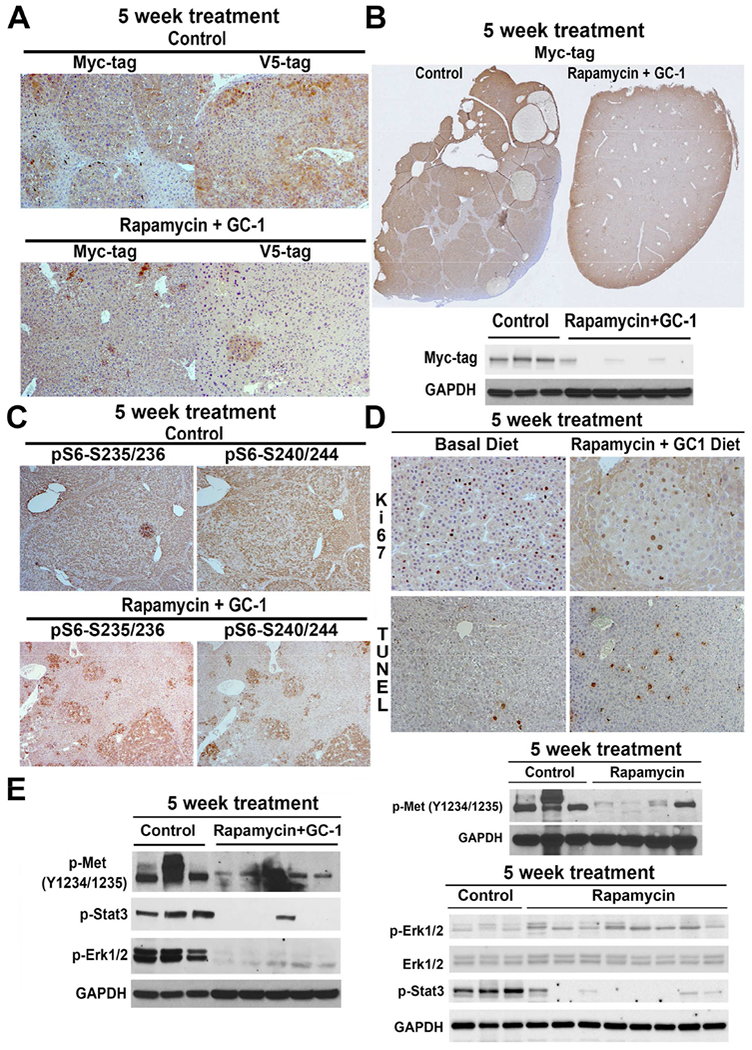
Figure 7. Five-week treatment with Rapamycin+GC1 combats Met-β-catenin HCC and is superior to treatment with Rapamycin alone.

A. IHC for Myc tag representing mutant-β-catenin and V5-tag representing c-Met, shows all tumors in basal diet group to be positive and thus derived from the injected plasmids. A notable decrease in IHC for both markers indicates a complete response to the combination therapy (50×).
B. A representative tiled image from IHC for Myc-tag from the basal diet-fed versus Rapamycin+GC1 diet-fed Met-β-catenin mice shows a dramatic difference in overall histologic tumor burden which was also confirmed by WB for Myc-tag. GAPDH confirmed equal loading.
C. IHC for p-S6-S235/236 and p-S6-240/244, indicators of mTORC1 activity, showed notably smaller positive nodules in the combination treatment as compared to basal diet in the Met-β-catenin model (50×).
D. Decreased number of tumor cells were PCNA-positive in the Rapamycin+GC1 group versus basal diet (100×), and increased number of TUNEL-positive cells were evident in the combination treatment than controls (100×).
E. Representative WB using lysates from tumor-bearing livers from Met-p-catenin HCC model comparing Met signaling in controls versus Rapamycin alone and controls versus Rapamycin+GC1. P-Met- and p-Stat3 were comparably downregulated in both treatment groups as compared to the controls, however p-Erk1/2 was decreased in only the Rapamycin+GC1 group. GAPDH verified comparable loading in both sets of analyses.
See also Figure S6.
