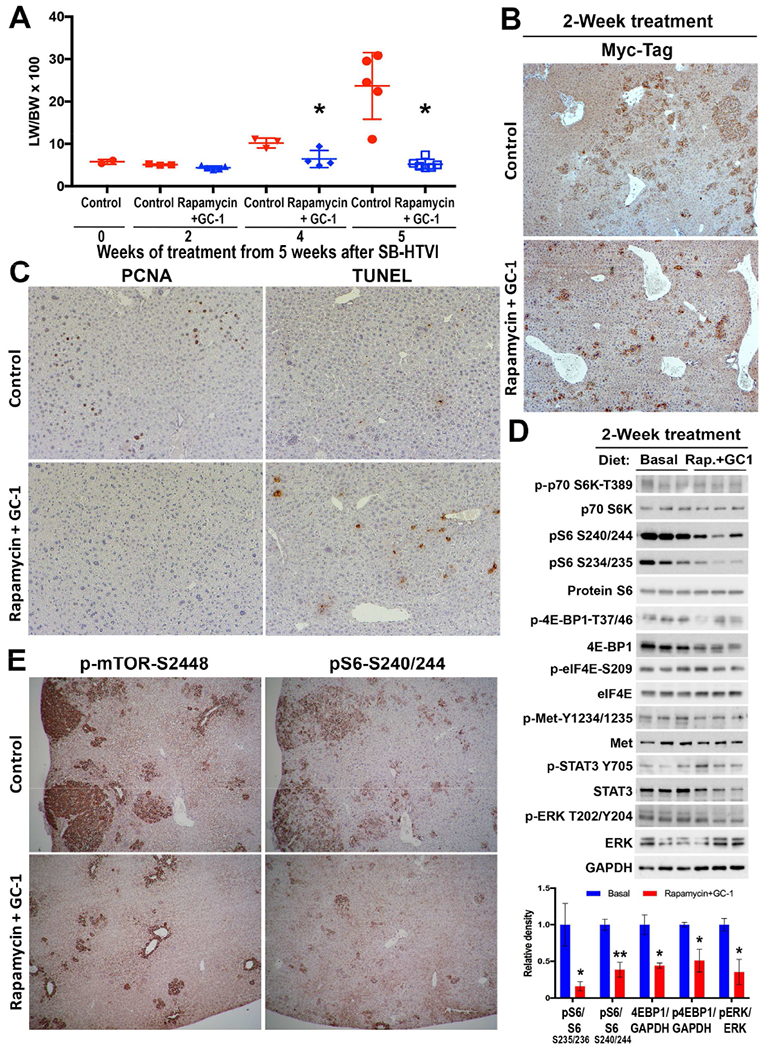
Figure 8. Two-week treatment of Met-β-catenin mice with Rapamycin+GC1 impacts mTORC1 and p-Erk signaling to reduce proliferation and increase cell death, to eventually affect HCC burden profoundly.

A. LW/BW was compared between controls and Rapamycin+GC1 group at 2, 4 and 5 weeks after intervention. Progressive increase in tumor burden was evident in controls but not in the combination treatment group. At 2 weeks of treatment, there was insignificant difference in LW/BW in the treatment group and controls (*p<0.05).
B. IHC for Myc-tag showed isolated cells or small clusters representing small tumor foci in the control and Rapamycin+GC1-treated Met-β-catenin mice at 2 weeks with marginally fewer and smaller foci seen in the treatment group (50×).
C. A notable decrease in the number of PCNA-positive tumor cells and an increase in the numbers of TUNEL-positive nuclei is evident in the Rapamycin+GC1 group as compared to basal diet fed controls at 2 weeks.
D. WB using liver lysates from Met-β-catenin mice on basal diet or Rapamycin+GC1 diet for 2 weeks show a notable decrease in p-S6-S235/236, p-S6-240/244, total 4EBP1 and p-4EBP1-T37/46 as well as p-Erk-T202/Y204 which was quantified and presented as bar graph (lower panel). WB for GAPDH depicts comparable protein loading.
E. Representative IHC shows a notable decrease in staining for p-mTOR-S2448 and pS6-S240/244 in 2-week Rapamycin+GC1 treatment versus controls.
