Figure. 5:

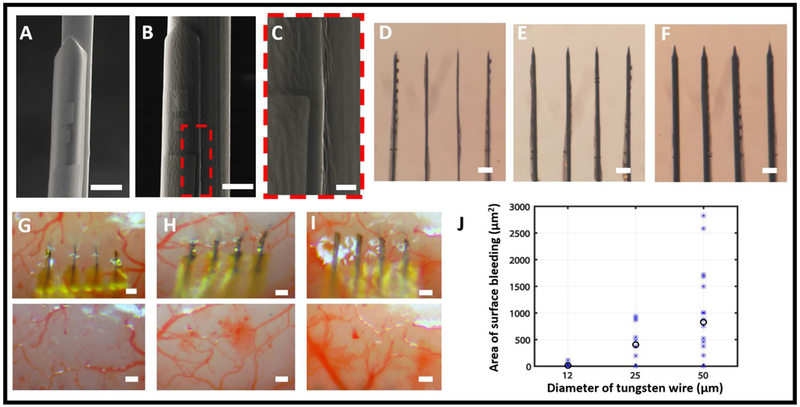
Shuttle microwires of different diameters and their insertion damage. (A – C) SEM images showing NETs attached to microwires with diameters of 25 μm (A) and 50 μm (B, C) using PEG. (C) is the zoomed-in view of the dashed box in B. The PEG layers, in all images, added negligible volume to the assembly. (D – F) Photographs showing NET arrays attached on microwires with diameters of 12 μm (D), 25 μm (E), and 50 μm (F). (G – I) Representative photographs showing in vivo insertion of NETs using microwires with diameters of 12 μm (G), 25 μm (H) and 50 μm (I), and the corresponding brain surface after the retraction of the wire. (J) The area of bleeding observed from brain surface for the three diameters of microwires. All trials (asteroid) and their averaged value (circle) are plotted. Scale bars: 25 μm (A and B); 5 μm (C), 100 μm (D-F and G-I).
