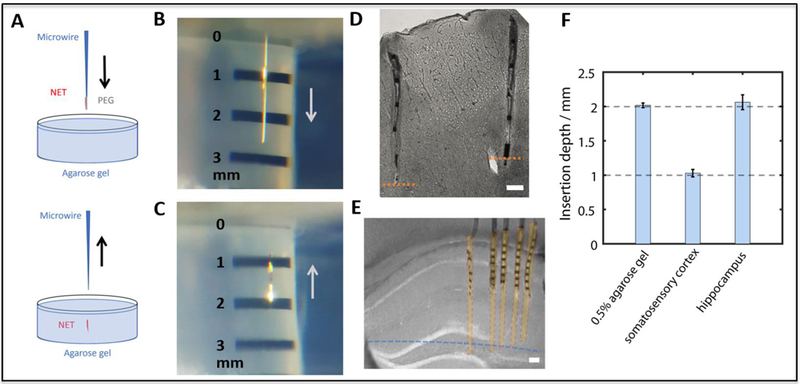
Figure 7:

In vitro and in vivo tests of insertion depth accuracy. (A) Sketch illustrating the in vitro test setup in the agarose gel. (B, C) Insertion of NETs in the agarose gel targeting the depth of 2 mm. (D) Stitched image of a brain slice showing two representative implanted NETs in the mouse somatosensory cortex (S1) at the designated depth of 1 mm. Orange dash lines mark the measured depth of 1mm from the brain surface. (E) Bright-field image of a brain slice with implanted NETs in mouse hippocampus. The blue dash line marks the measured depth of 2mm from the brain surface. Part of the shanks were sliced off during sample preparation. Yellow shaded areas mark the estimated coverage of the recording regions. (F) Measured insertion depths and standard deviation in gel, cortex and hippocampus. Insertions targeted depths at 2 mm in gel and hippocampus, and at 1 mm in somatosensory cortex. Scale bars: 100 μm.
