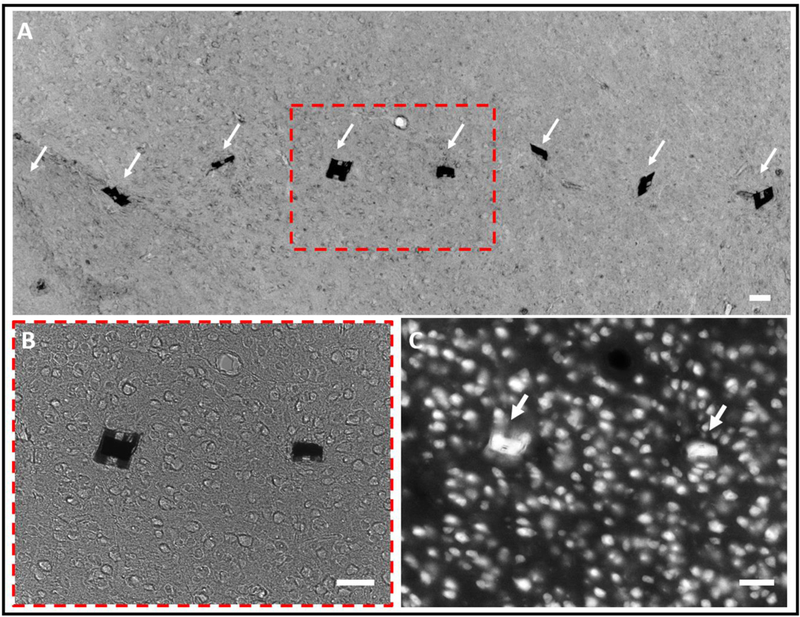
Figure 8:

Tissue-NET interface two months after implantation. (A) Bright-field image of a tissue slice (20 μm thick) in the mouse cortex where an 8-shank NET probe was implanted. The arrows highlight the implanted locations of the NETs, in which one out of eight was dragged out during tissue slicing. (B) Zoom-in view of the dashed box in (A), showing that the tissue morphology near the NETs was normal. (C) Fluorescent image of the same tissue slice where neuron cell bodies were fluorescently labeled. Scale bars: 50 μm.
