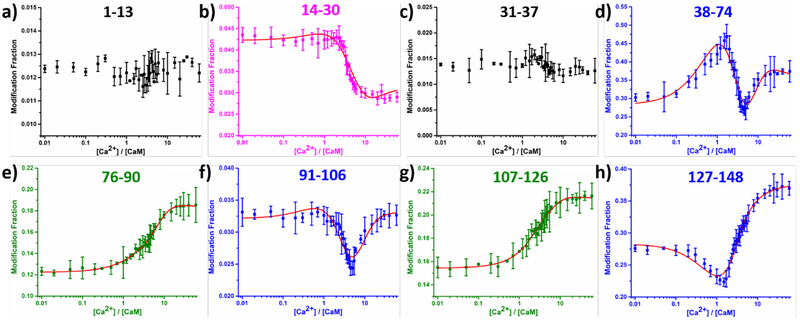
Figure 2.
LITPOMS response at peptide level, where modification fractions were plotted as a function of calcium:calmodulin ratio. Four different classes of behaviors are shown in black (a and c), magenta (b), blue (d, f and h) and olive (e and g). Red solid lines in (b), (d), (e), (f), (g) and (h) are from fitting using an algorithm reported previously.25, 33 Data points represent average of two runs, and error bars are standard deviations. Modification fractions reported here accounts for all resolvable oxidations, for which a maximum of +32 were observed at peptide level.

