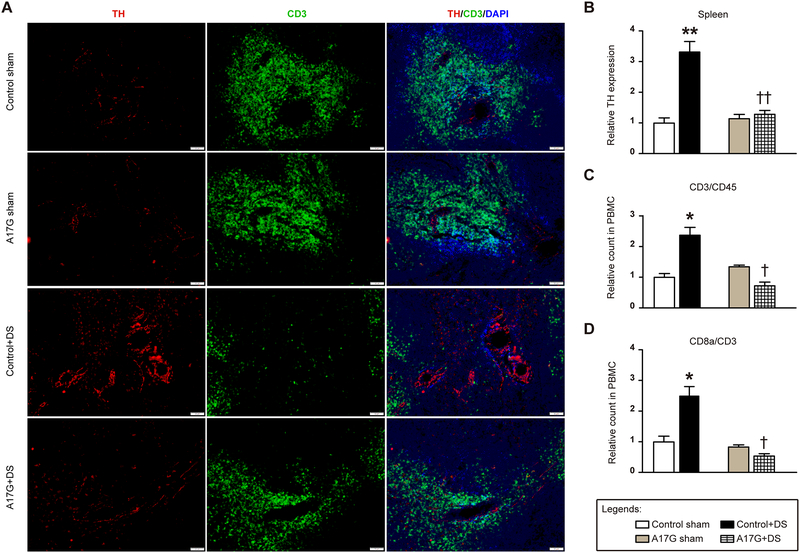
Figure 4. Normalized sympathetic outflow attenuates T cells activation in mice with ADAM17 knockdown in glutamatergic neurons.
(A) Immunofluorescence triple-labeling of spleen sections from A17G and control mice, showing tyrosine hydroxylase (TH, red), cluster of differentiation 3 (CD3, green) and nuclei (DAPI, blue). The scale bar represents 50 μm. (B) Summary data for TH expression in mouse spleens (n=4–6 sections/mouse, 4 mice/group). (C) Blood panel analysis on T cells (CD3+/CD45+) in isolated peripheral blood mononuclear cells (PBMC) via flow cytometry (n=10 mice/group). (D) Blood panel analysis on CD8+ T cells in isolated PBMC (n=10 mice/group). Statistical significance: Two-way ANOVA: *P<0.05, **P<0.01 vs. respective shams; †P<0.05, ††P<0.01 vs. control+DS. DS: DOCA-salt.

