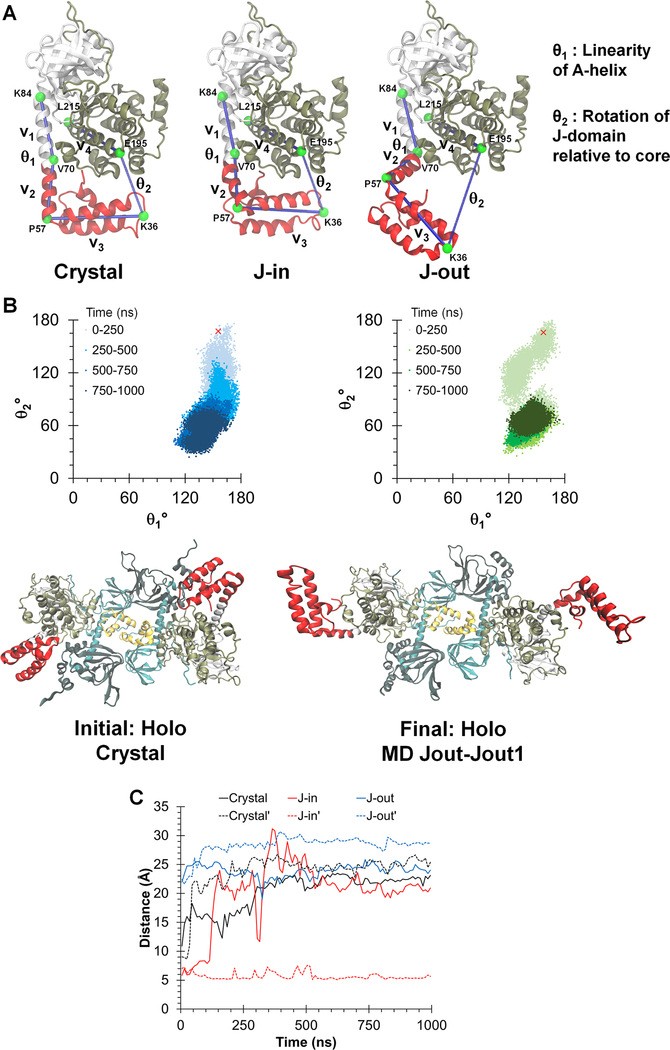
Figure 2. Dynamic conformations of J-domains in the chimeric holoenzyme during MD simulations.
(A) Three different simulations were initiated from: the chimeric crystal structure (crystal), the J-in and J-out states. θ1 and θ2 are angles defined to probe the dynamics of the J-domain.
(B) Top: Orientation of the J-domain for both copies of the chimera in the RIα2:J-PKAcα2 holoenzyme, as given by θ1 and θ2 over a 1 μs simulation of the chimeric holoenzyme starting from the crystal structure. The red ‘x’ indicates the position of the J-domain at the beginning of the simulation. Darker colors indicate later in time. Larger values of θ2 indicate a conformation in which the J-domain is tucked underneath the PKAcα core while smaller values indicate an extended conformation. Bottom: Initial and final conformations of the RIα2:J-PKAcα2 simulation started from the crystal structure.
(C) Minimum Cα distances between the J-domain and the adjacent RIα subunit for the three simulations. Solid and dotted lines indicate each copy of the J-domain in the holoenzyme respectively.

