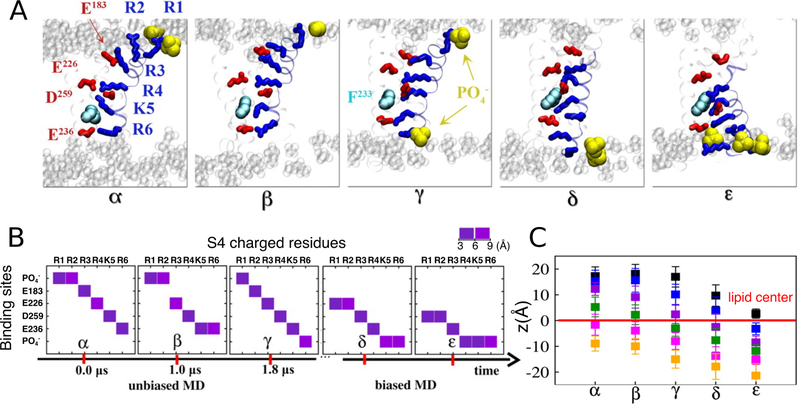
Figure 12.
Representative conformations (α, β, γ, δ, and ε) of the Kv1.2 voltage sensor domain revealed during the unbiased and subsequent biased-MD simulations. (A) Molecular views of the five key conformations highlighting the positions of the S4 basic residues (blue sticks) and their binding sites (acidic residues: red sticks, lipid : yellow vdW) during the gating transition. (B) The closest interacting partner with each of the S4 basic residues in the five conformations. Lipid groups were involved in providing counter-charges for the S4 basic residues during the gating process. (C) Positions of the S4 basic residues R1 (black) through R6 (orange) with respect to the membrane midplane (z=0) for each intermediate conformation. Adapted with permission from ref 240. Copyright 2011 Delemonte et al.

