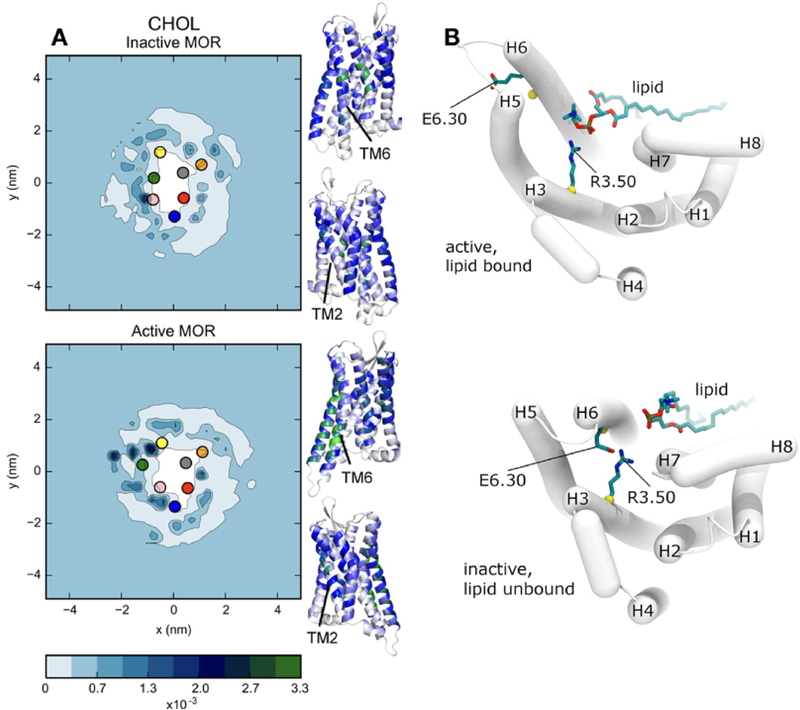
Figure 23.
Lipid-modulated structural dynamics of membrane receptors. (A) Normalized probability distribution of cholesterol around inactive (upper panel) and active (lower panel) μ-opioid receptor (MOR) captured in μs-long CG simulations. The colored circles indicate the center of mass of transmembrane (TM) helices: TM1 through 7 are colored in blue, red, grey, orange, yellow, green, and pink, respectively. Inactive and active structures of MOR with residues colored by their probability of being in contact with cholesterol (low to high probability indicates white to blue to green). Reprinted with permission from ref 389. Copyright 2016 Marino et al. Licensed under a Creative Commons Attribution 4.0 International License. (B) Zwitterionic lipid binding to the arginine component of the ionic lock of active, lipid-bound state (upper panel) and inactive, lipid-unbound state (lower panel) of β2AR. Adapted with permission from ref 387. Copyright 2015 Elsevier.

