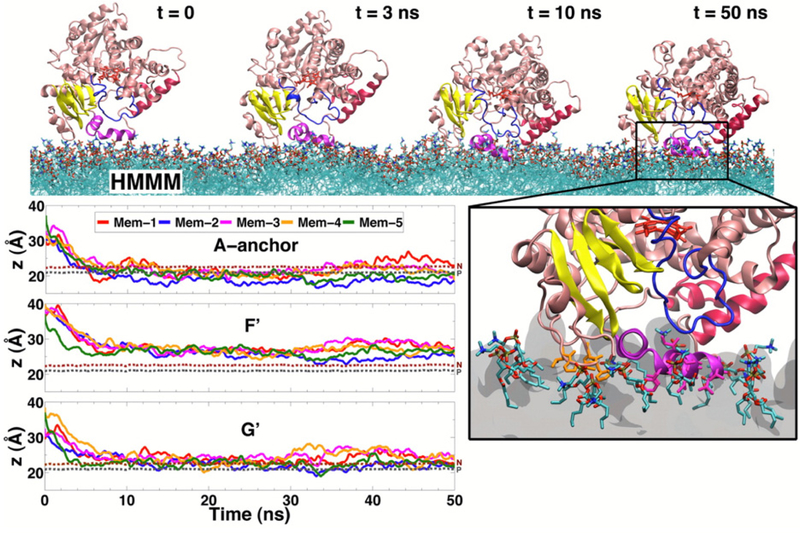
Figure 28.
Spontaneous membrane binding of CYP3A4. (Top) Snapshots taken at different time points in the simulation. (Bottom right) Close-up view of the membrane-bound form of CYP3A4, highlighting residues inserting directly into and interacting with the membrane. (Bottom left) Time evolution of average height of the center of mass for individual membrane anchoring helices (A, F’, G’) in five independent simulations (listed as Mem-1 through Mem-5). The average positions of the phosphorus (PO4) and the nitrogen (choline) atoms of the lipid headgroups are shown as gray and brown dotted lines, respectively.178 Reprinted with permission from ref 178. Copyright 2013 American Chemical Society.

