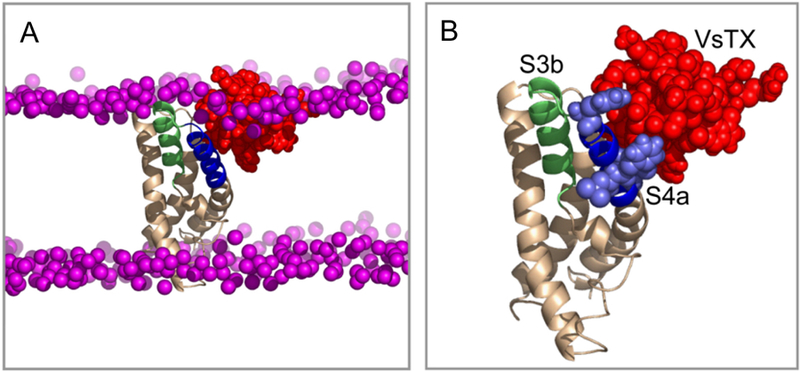
Figure 33.

Example of a refined voltage sensor (VS)/VsTX1 complex structure, showing a t = 20 ns snapshot from an AA simulation. (A) Complex in a bilayer showing the VS in beige (with the S3b and S4a helices in green and blue, respectively), VsTx1 in red, and the phosphorus atoms of the lipids in purple. (B) View of the complex with the consensus interaction side chains of S4a (consensus between simulation and experiment) in pale blue in a space-filling representation. 581 Reprinted with permission from ref 581. Copyright 2010 Elsevier.
