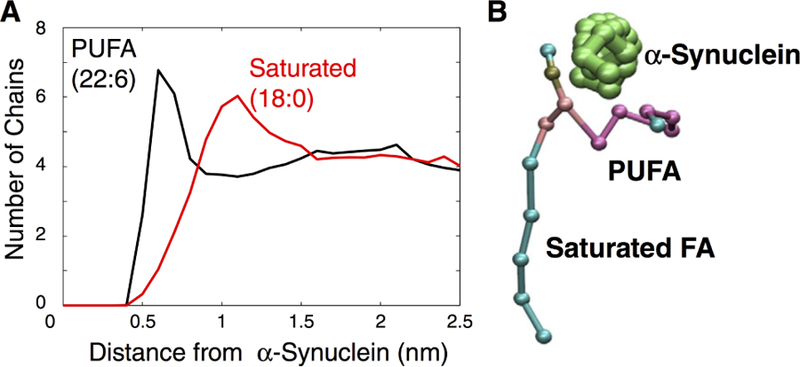
Figure 36.

(A) Distribution of lipid-protein distances between lipids with polyunsaturated fatty acid (PUFA) and all-saturated lipids. The black plot shows the distances between the PUFA chain and the protein. The red plot shows the distances between the saturated chain and the protein. This data was sampled using 0.1 nm radial bins and averaged over the last 500 ns of a 10.5 μs CG simulation. (B) Snapshot of a single asymmetric lipid near the α-synuclein helix which is perpendicular to the page. Reprinted with permission from ref 642. Copyright 2017 Elsevier.
