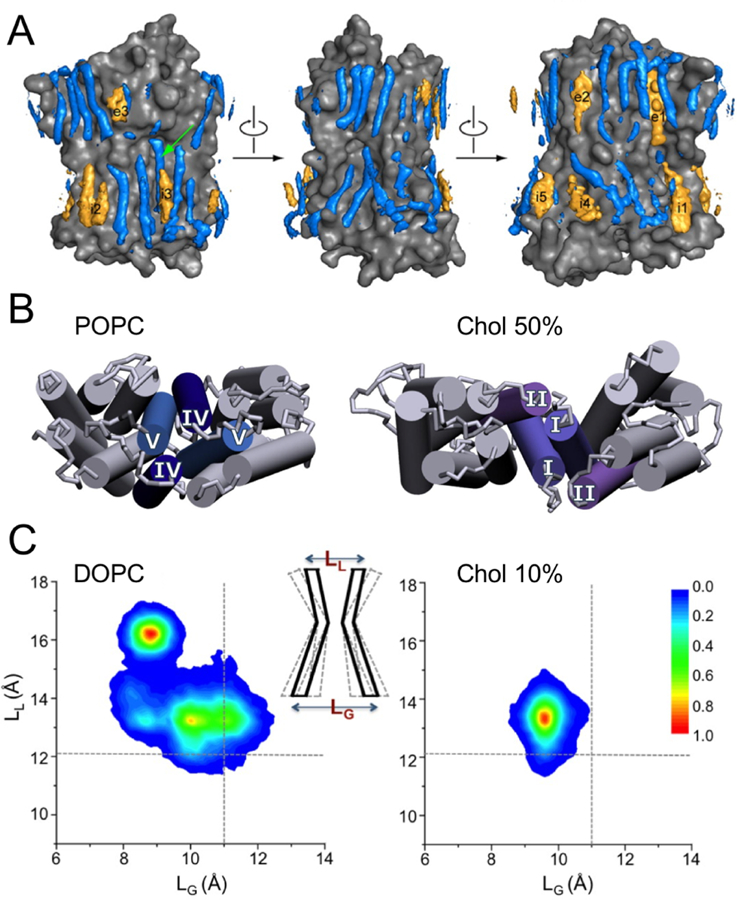
Figure 40.

Cholesterol modulation of human β2AR characterized by MD simulations. (A) Cholesterol binding sites are shown in orange, and POPC binding sites shown in blue for comparison. Reprinted with permission from ref 403. Copyright 2013 American Chemical Society. (B) β2AR dimer interface formed by helices IV/V and I/II at 0% and 50% cholesterol (Chol) concentration, respectively. Adapted with permission from ref 404. Copyright 2014 Elsevier. (C) β2AR conformational dynamics restricted by cholesterol binding. LL and LG denote the distances between the Cα atoms of D113-S207 at the extracellular ligand-binding site and R131-E268 at the intracellular G-protein interface, respectively. Reprinted with permission from ref 413. Copyright 2016 Manna et al. Licensed under a Creative Commons Attribution 4.0 International License.
