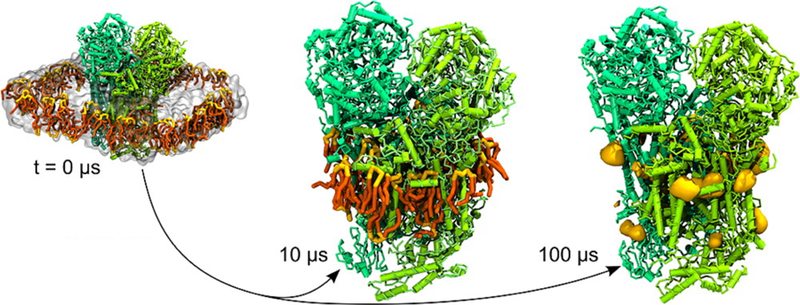
Figure 43.

CG simulations describe the diffusion of CDL in a mixed POPC/CDL bilayer and enable the detection of stable binding sites of CDL on the surface of the cytochrome bc1 complex. The CDL binding sites shown in yellow volume are mapped at an isovalue corresponding to at least 5 times the average bulk density. Reprinted with permission from ref 440. Copyright 2013 American Chemical Society.
