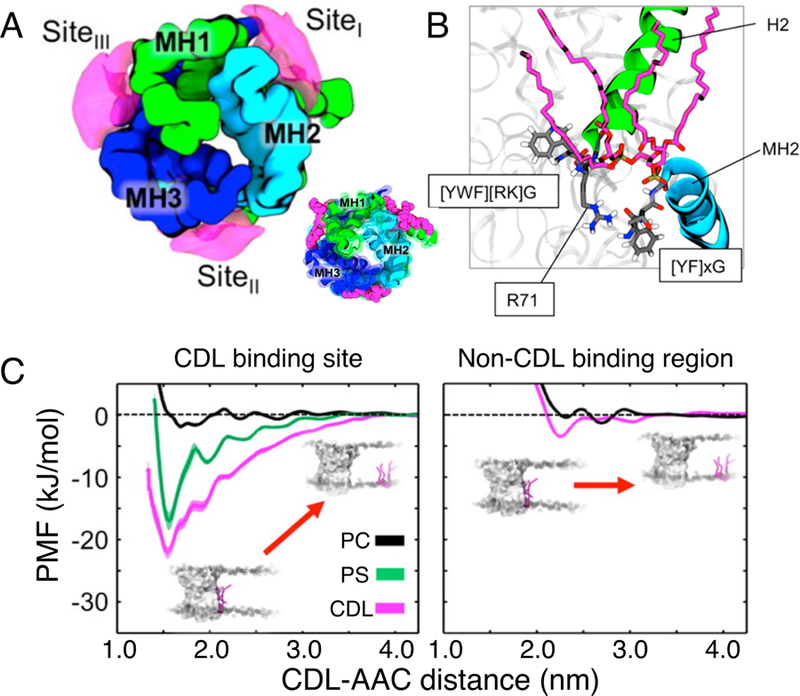
Figure 45.

CDL interaction with the mitochondrial ADP/ATP carrier (AAC). (A) The time-averaged probability density surface of the CDL binding sites (magenta) revealed by CG simulations. Inset illustrates CDL binding sites observed in the X-ray structure (PDB: 1OKC). (B) The arrangement of the conserved motifs (grey) around the bound CDL (magenta) after refinement with AA simulations. (C) Potential of mean force profiles for the interaction of various lipids (CDL, PC and PS) at the X-ray observed CDL binding site (left) and a control non-CDL binding region (right). At the X-ray binding site, CDL binds more favorably than PS and PC. Adapted with permission from ref 369. Copyright 2016 American Chemical Society.
