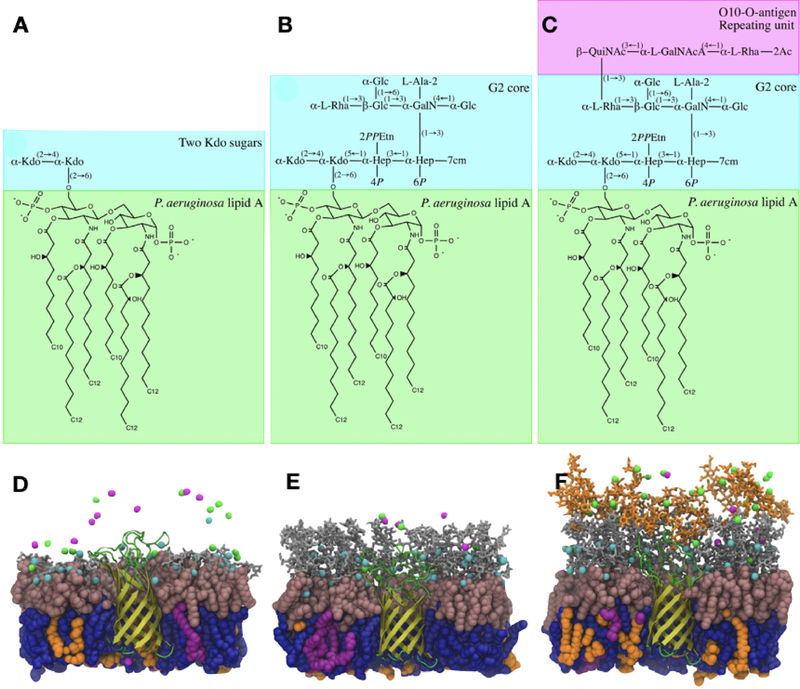
Figure 47.
Computational modeling of OprH in an LPS bilayer. Chemical structures of lipid A, LPS core sequences and O-antigen of outer membrane (OMs) with the corresponding simulation box are shown in (A-F). The color representations are as follows: pink spheres, lipid A; orange sticks, O10-antigen polysaccharides; gray sticks, core sugars; blue spheres, PPPE; orange spheres, PVPG; magenta spheres, PVCL2; small cyan spheres, Ca2+ ions; small magenta spheres, K+ ions; small green spheres, Cl ions. 305 Reprinted with permission from ref 305. Copyright 2017 Elsevier.

