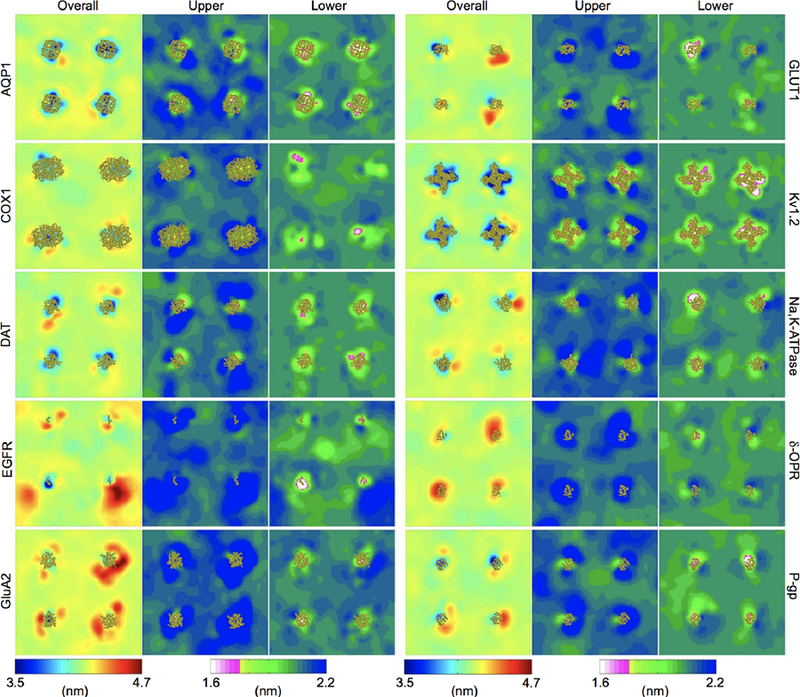
Figure 48.

Membrane thickness profiles near ten different membrane proteins from CG simulations. For each of the simulation systems, membrane thickness is shown as 2D maps, averaged over the simulations from 25 to 30 μs. Overall thickness, the distance calculated between the upper and lower surfaces, is shown color-coded according to a 3.5–4.7 nm scale. The thickness for the upper leaflet (as distance between the upper and the middle plane) and for the lower leaflet (as distance between the lower and the middle plane) is shown on a different color scale, ranging from 1.6 to 2.2 nm. The position of the four protein copies in each simulation box is indicated by drawing the proteins in yellow ribbons. The studied membrane proteins are aquaporin AQP1, cyclooxyge-nase COX1, dopamine transporter DAT, epidermal growth factor receptor EGFR, AMPA receptor GluA2, glucose transporter GLUT1, K+ channel Kv1.2, Na+-K+ pump Na,K-ATPase, opioid receptor δ-OPR, and P-glycoprotein P-gp. Reproduced with permission from ref 913. Copyright 2018 American Chemical Society.
