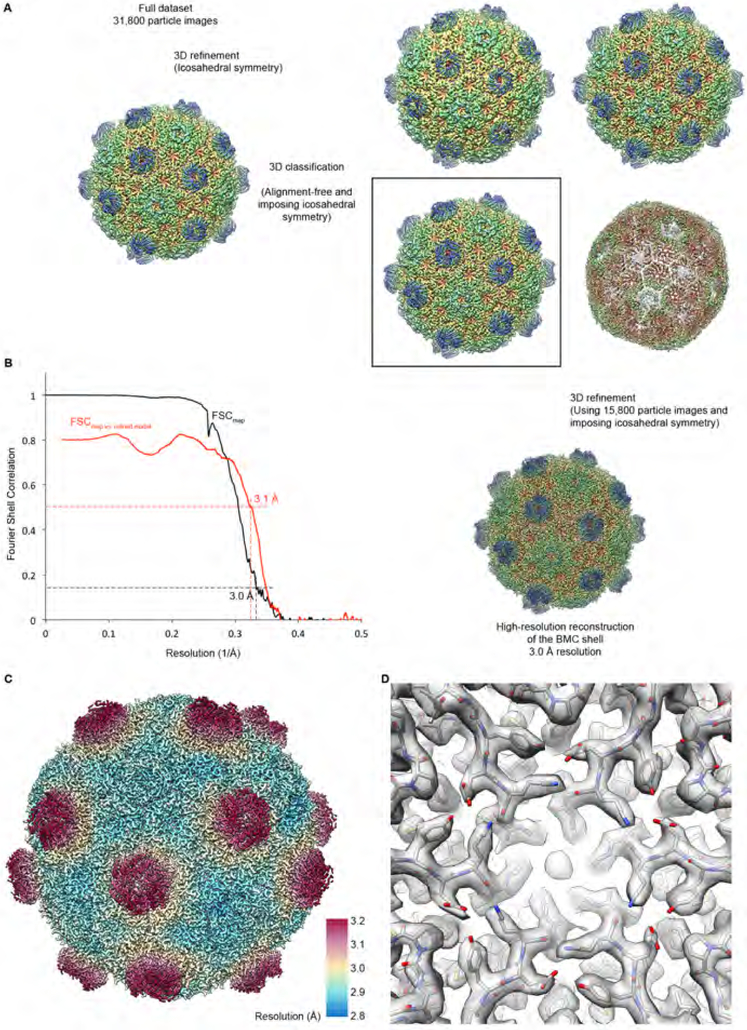
Fig. 2. Cryo-EM structure determination.
(A) Data processing workflow for high-resolution reconstruction of the structure of the HO shell. See text and STAR Methods for details.
(B) Resolution estimation for the cryo-EM map. Black: Fourier Shell Correlation (FSC) curve between two cryo-EM half-maps obtained by frequency-limited refinement (see Methods), indicating a resolution of 3.0 Å according to the FSC = 0.143 criterion (Rosenthal and Henderson, 2003; Scheres and Chen, 2012). Red: FSC curve between the cryo-EM map and refined coordinates, indicating good correlation to 3.1 Å according to the FSC = 0.5 criterion (Rosenthal and Henderson, 2003). These criteria (FSC = 0.143 for half-map FSCs and FSC = 0.5 for model vs. map FSCs) are applied throughout this work.
(C) Local resolution estimate for the cryo-EM reconstruction of the HO shell. Most of the shell is resolved at 3 Å or better, while the protruding BMC-T modules are still resolved at better than 3.5 Å resolution.
(D) View of the cryo-EM density with the fitted atomic coordinate model.

