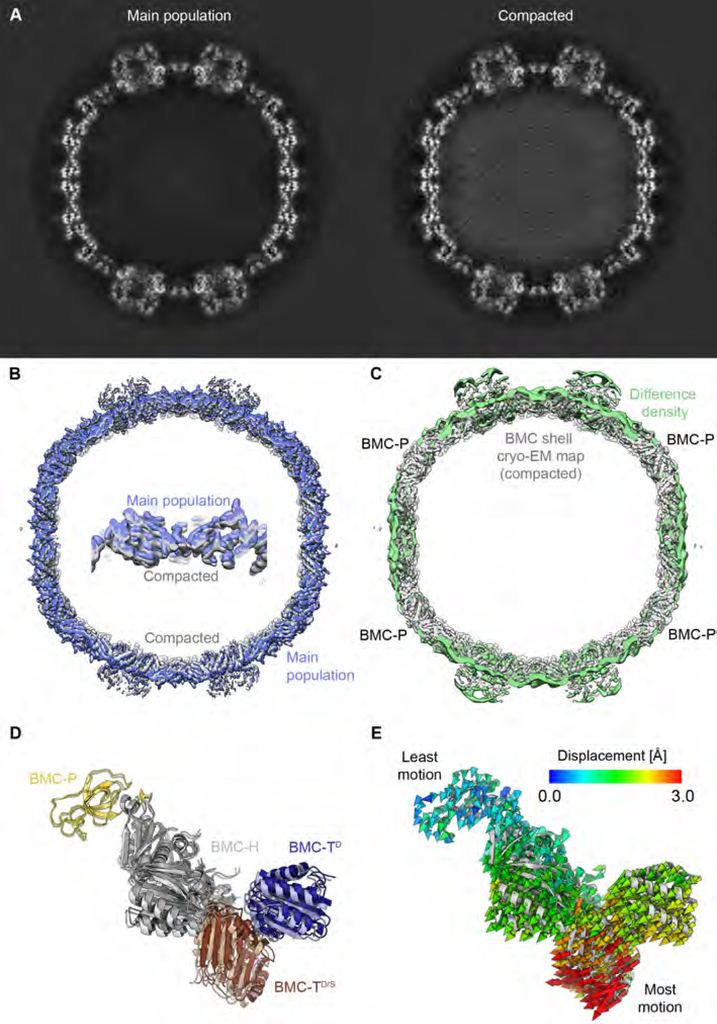
Fig. 6. Global structural variations between HO BMC shell subpopulations.
(A) Slices of the 3D maps of the main BMC shell population (left) and the compacted BMC shell population (right).
(B) Views of the densities of the main particle population (blue) and the compacted shell (light grey).
(C) Difference density resulting from the subtraction of the cryo-EM density of the compacted shell from the density of the main shell population is shown in light green, superposed onto the reconstruction of full map of the compacted state (grey). The difference is smallest at the BMC-P positions.
(D) Side view of the asymmetric unit of the main shell population colored and labeled by subunit type. The corresponding model from the compacted shell is shown in lighter colors.
(E) Same view as D, with color-coded displacement vectors indicating the differences of Cα positions between the compacted and main shell conformations. BMC-P is least displaced while the shell-embedded ring at the BMC-T position is most displaced. See also Figure S1, Table S1.

