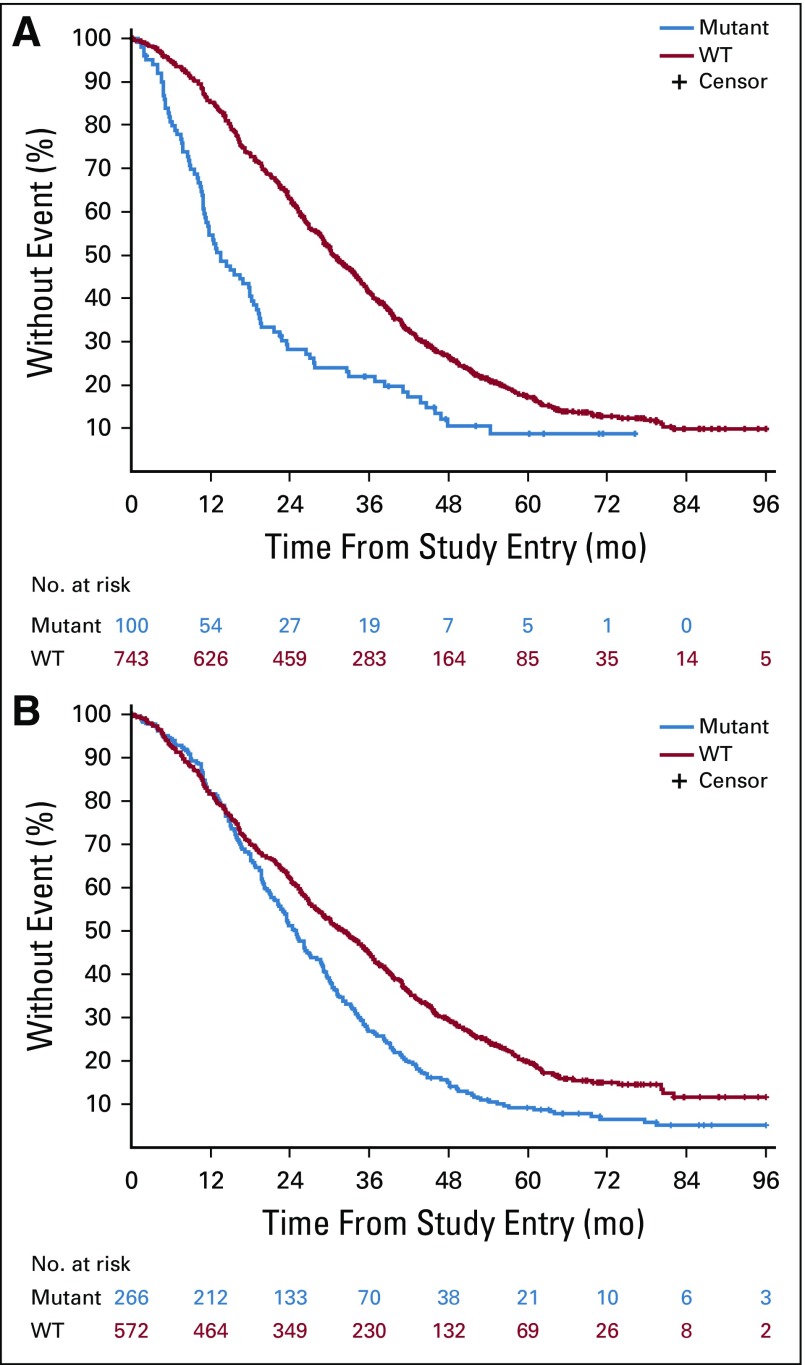
FIG 2.
Kaplan-Meier plots of the effect of BRAF mutations (top) and extended RAS mutations (bottom) on overall survival. Log-rank P values are reported from an unadjusted analysis. The results refer to all patients for whom mutational analysis was available, which includes pre-KRAS amendment and post-KRAS amendment patients. WT, wild type.

