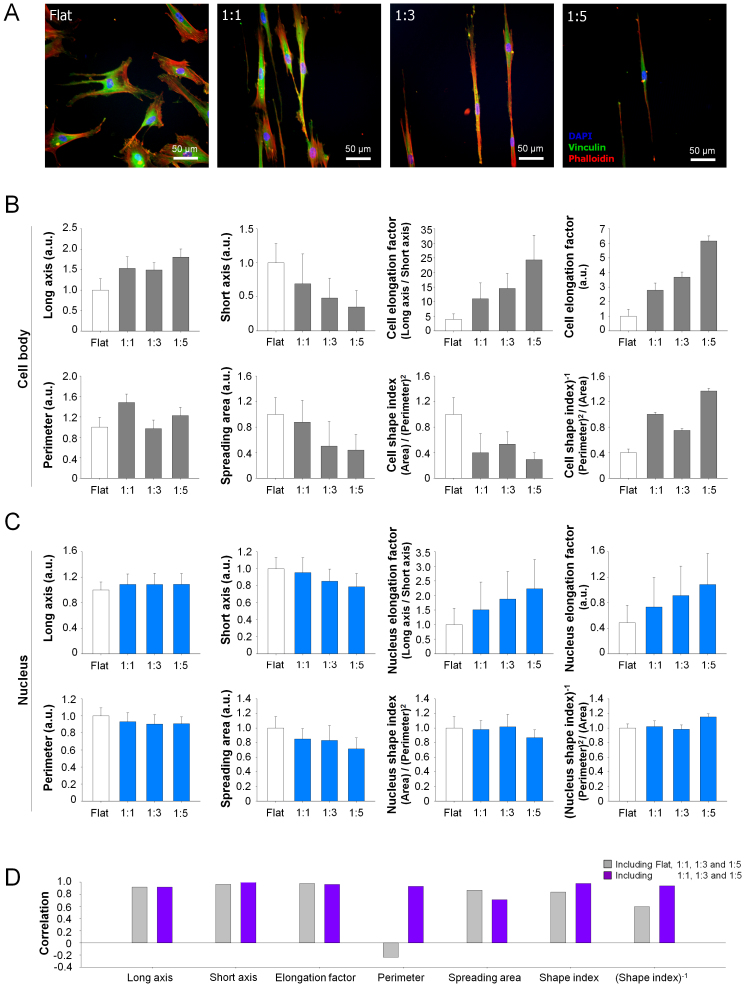
Figure 2. Effect of nanotopographical density on the cell morphology.
(A) Representative immunofluorescent images of F-actin (red), vinculin (green), and DAPI (blue) of hMSCs cultured on the flat and various nanopatterned surfaces, indicating that the structure of hMSCs was sensitively regulated by nanotopographical density. (B and C) Quantification of cell body and nucleus. The values of perimeter and area were normalized to the flat substrates. The 50–100 cells were used for quantification. Error bars represent the SD about the means. (D) Correlation between cell body and nucleus.

