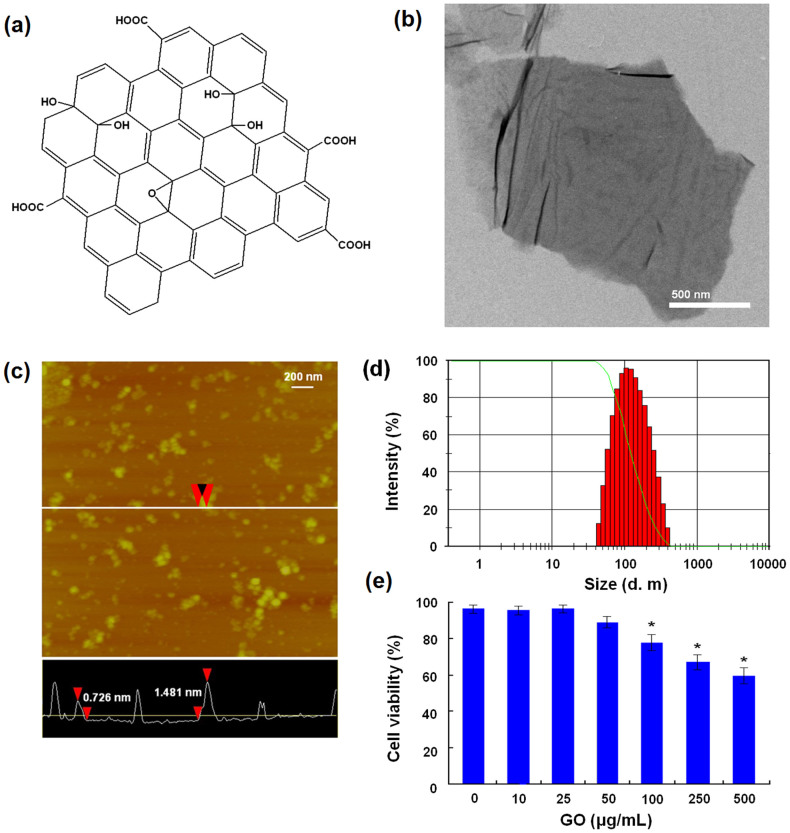
Figure 1. Characterization of GO and its impairment of cell viability.
(a) Chemical structure of GO. (b) TEM image of GO. (c)AFM image of small sized GO. (d) Size distribution of small sized GO. (e) Cytotoxicity of GO against MDA-MB-231 cells. * indicates P < 0.05 for comparison with the control at GO concentration of 0 μg/mL.

