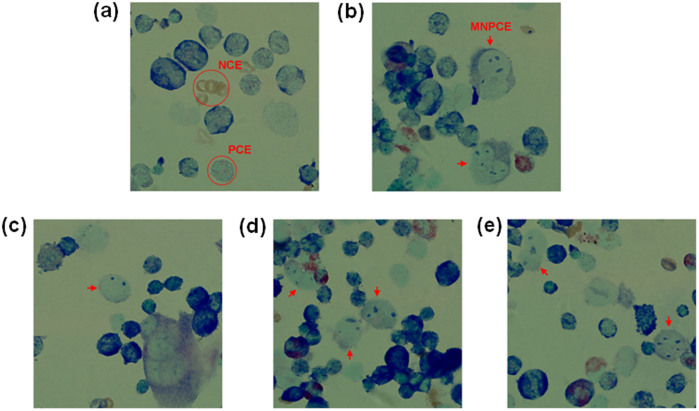
Figure 6. Representative pictures of mouse bone marrow cells in microbucleus test.
(20× magnification, Giemsa staining). (a) The negative control with physiological saline treatment. (b): the positive control with cyclophosphamide treatment. (c–e) GO treatments at 5, 10 and 20 mg/kg, respectively. PCE: polychromatic erythrocyte; NCE: normochromatic erythrocyte; MNPCE: micronucleus (MN) in polychromatic erythrocyte (red arrow).

