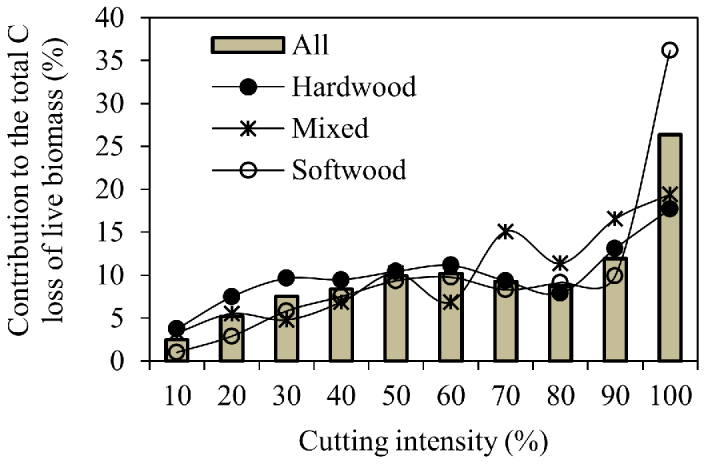
Figure 2. Contributions (%) of forest cutting with different cutting intensities to the total C loss of live biomass.

Cutting intensities are defined as the percent of live biomass loss per sample plot caused by forest cutting during a revisiting cycle (around 5 years).
