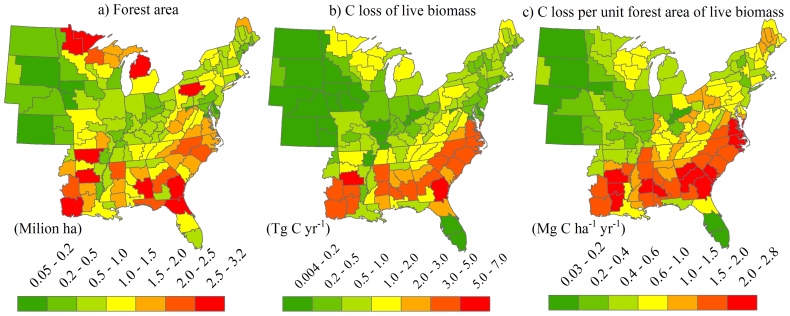
Figure 6. Spatial distribution of the forest area (a), the cutting-induced C loss in live biomass (b), and the C loss density (c) averaged over 2002–2010 for each FIA survey unit in the eastern United States.
Maps were generated using ArcGIS 9.3 (www.esri.com/software/arcgis).

