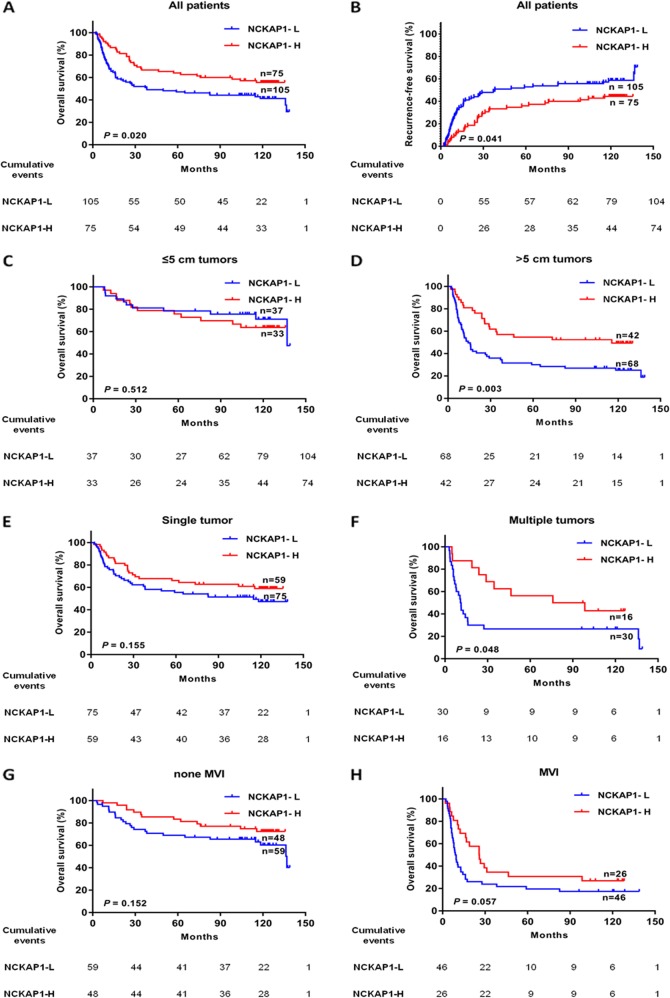
Fig. 2. Effect of tumor cell expression of NCKAP1 on the prognoses of all patients and patients stratified into subgroups.
a Kaplan–Meier survival analysis of overall survival (OS) in all patients. The OS in the NCKAP1-high expression group was significantly increased compared with that in the NCKAP1-low expression group (P = 0.02). b Kaplan–Meier survival analysis of recurrence free survival (RFS) in all patients. The RFS in the NCKAP1-high expression group was significantly increased compared with that in the NCKAP1-low expression group (P = 0.047). c Patients with tumor diameter ≤5 cm. d Patients with tumor diameter >5 cm. The OS in the NCKAP1-high expression group was significantly increased compared with that in the NCKAP1-low expression group (P = 0.003). e Patients with a single tumor. f Patients with multiple tumors. The OS in the NCKAP1-high expression group was significantly increased compared with that in the NCKAP1-low expression group (P = 0.049). g Patients without microvascular invasion. h Patients with microvascular invasion. The OS in the NCKAP1-high expression group was significantly increased compared with that in the NCKAP1-low expression group (P = 0.047)

