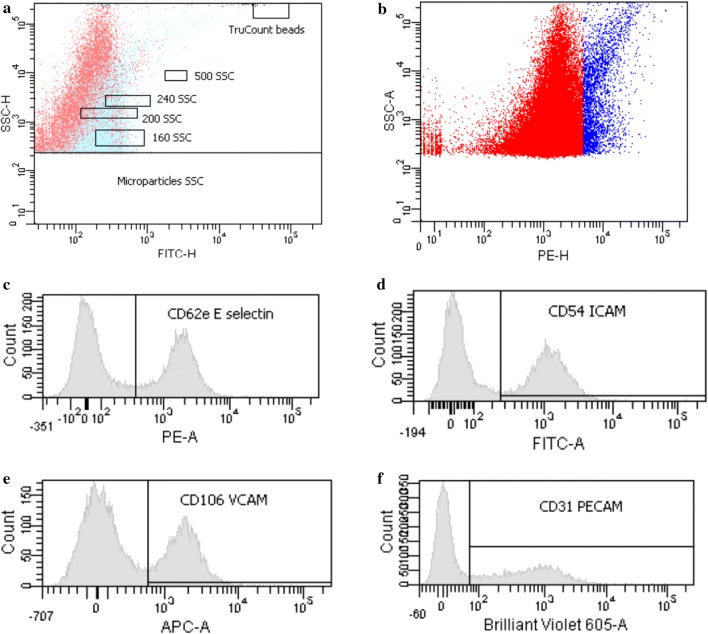
Fig. 3.
Representative side scatter (SSC-H) by FITC height (FITC-H) (panel A) and PE height (PE-H) (panel B) dot plots showing the total number of microparticles and CD144+ microparticles. In addition, representative flow cytometric histograms showing cell surface expression of CD31-PECAM (panel B), CD62e-E-selectin (panel C), CD54-ICAM (panel D) and CD106-VCAM (panel. Mean fluorescence intensity (MFI) was established using Cytometer Setup and Tracking Beads (BD) and isotype negative controls

