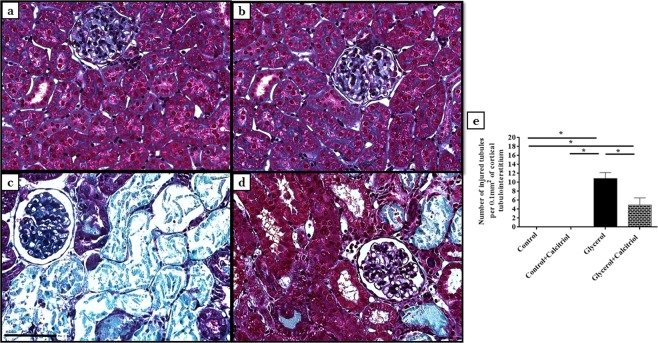
Figure 1.
Histological sections stained with Masson’s Trichrome representative of control (a), control + calcitriol (b), glycerol (c) and glycerol + calcitriol (d) animals. Number of injured tubules (e) of the different groups. Note that tubulointerstitial lesions are more intense in (c) than in (d). The bar indicates 50 μm. The data are expressed as the means ± SEM. *Denotes a statistical significance of P < 0.05 between the groups. (n = 7–10 per group). Magnification, ×400.

