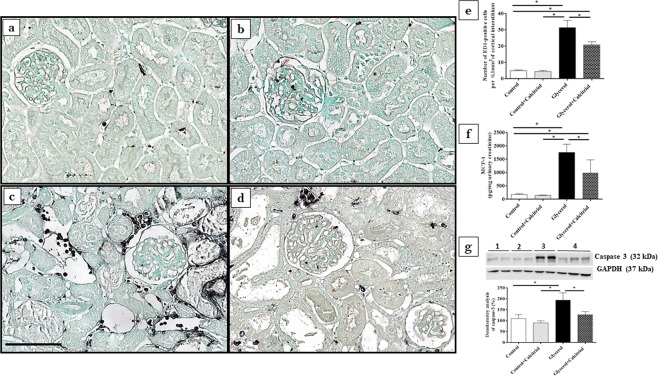
Figure 3.
Immunolocalization of ED1+ cells (macrophages) in the renal cortex of control (a), control + calcitriol (b), glycerol (c) and glycerol + calcitriol (d) animals and number of ED1+ cells in the tubulointerstitial compartment (e). The bar indicates 50 μm. Levels of urinary MCP-1 (f) evaluated by ELISA of animals from different groups. Western blot analysis of caspase 3 (g) in the renal cortex of control (lane 1), control + calcitriol (lane 2), glycerol (lane 3) and glycerol + calcitriol (lane 4) animals. The densitometric ratio between caspase 3 and GAPDH was calculated, and the data are expressed compared with that of the control group, with the mean (±SEM) control value designated 100%. Blots are representative images from independent experiments. The data are expressed as the means ± SEM. *Denotes a statistical significance of P < 0.05 between the groups. (n = 7–12 per group). Magnification, ×400.

