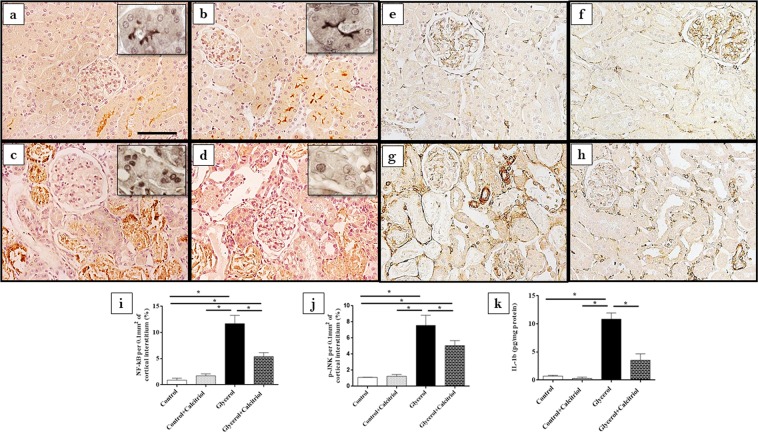
Figure 5.
Immunolocalization of NF-κB (a–d) and p-JNK (e–h) in the renal cortex of control (a,e), control + calcitriol (b,f), glycerol (c,g) and glycerol + calcitriol (d,h) animals. The bar indicates 50 μm. Inset: slices without counterstaining. Percentage of the tubulointerstitial area of the renal cortex marked with NF-κB (i) and p-JNK (j) in the animals from different groups. Levels of IL-1β in the renal cortex (k) evaluated by ELISA of animals from different groups. The data are expressed as the means ± SEM. *Denotes a statistical significance of P < 0.05 between the groups. (n = 7–12 per group). Magnification, ×400; inset magnification, ×840.

