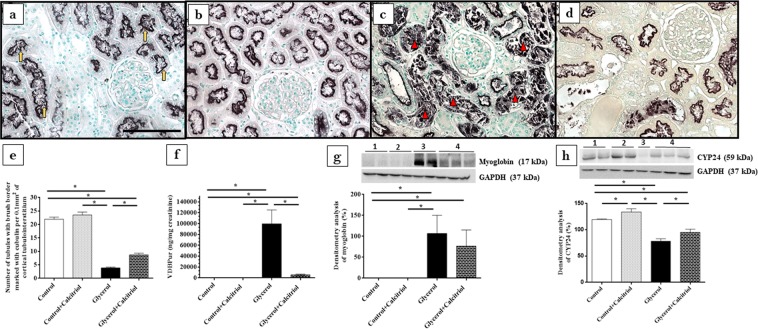
Figure 6.
Immunolocalization of cubilin in the renal cortex of control (a), control + calcitriol (b), glycerol (c) and glycerol + calcitriol (d) animals. The bar indicates 50 μm. Number of tubules with brush border marked with cubilin of animals from different groups (e). Note that labeling for cubilin is present in the brush border of the tubular cell in controls animals (yellow arrow), whereas in animals of the glycerol group the labeling is more present in the tubular lumen (red arrowhead) due to loss of the epithelial cells from the proximal tubule, as a consequence of acute tubular injury; this commitment is lower in animals of the glycerol + calcitriol group. Urinary excretion of VDBP evaluated by ELISA in the different groups (f). Western blot analysis of myoglobin expression (g) and CYP24 (h) in the renal cortex of control (lane 1), control + calcitriol (lane 2), glycerol (lane 3), and glycerol + calcitriol (lane 4) animals. The densitometric ratio between myoglobin, CYP24 and GAPDH was calculated, and the data are expressed compared with that of the control group, with the mean (±SEM) control value designated 100%. Blots are representative imagens from independent experiments. The data are expressed as the means ± SEM. *Denotes a statistical significance of P < 0.05 between the groups. (n = 6–7 for each group). Magnification, ×400.

