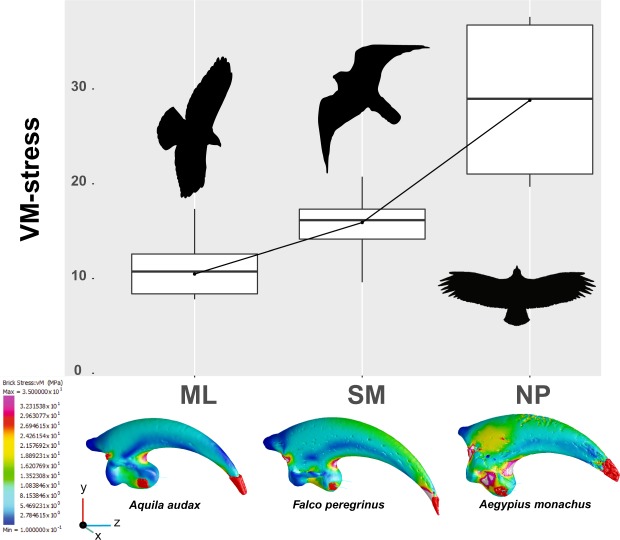
Figure 2.
Boxplot of mean VM stress values detected at the 26 homologous landmarks and representative FEMs for the three dietary categories. Bottom and top of the boxes are the first and third quartiles, the horizontal black lines represent the mean and whiskers represent the minimum and maximum values. Animal silhouettes were available under Public Domain license at phylopic (http://phylopic.org/). Specifically, starting from the left, Accipitrinae (http://phylopic.org/image/e00734a7-e8a8-4fe5-b5a9-58d927ca451a/), This image is available for reuse under the Public Domain Dedication 1.0 license; Falconidae (http://phylopic.org/image/6cebf754-cb71-448d-a5bb-947157205264/), available for reuse and under the Creative Commons Attribution 3.0 Unported (https://creativecommons.org/licenses/by/3.0/) image by Liftarn; Cathartiformes (http://phylopic.org/image/901bfc1f-5f97-499c-961f-6cf4d8ab6239/), available for reuse and under the Creative Commons Attribution 3.0 Unported (https://creativecommons.org/licenses/by/3.0/) image by Mark P. Witton & Darren Naish.

