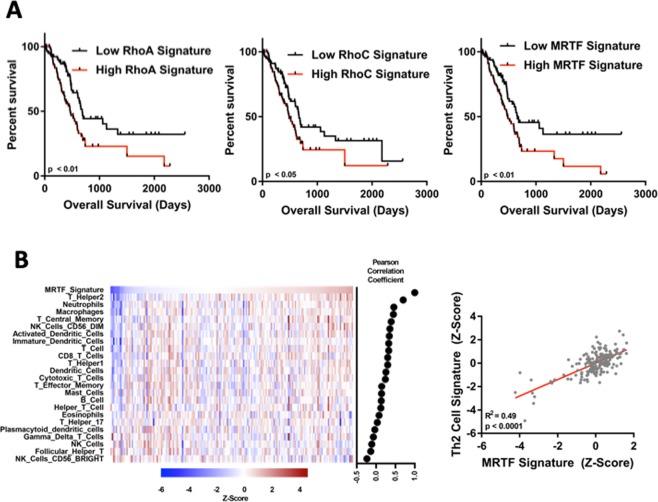
Figure 6.
Rho/MRTF pathway expression in human pancreatic cancer. (A) The Cancer Genome Atlas (TCGA) pancreatic cancer dataset was stratified into halves based upon predicted RhoA, RhoC or MRTFA activation (n = 83 per group). Kaplan–Meier plots were generated from the highest (black) and lowest (red) expressing halves. Survival curves were analyzed with the log-rank (Mantel-Cox) test with a cutoff of P < 0.05 as statistically significant. (B) Pearson correlation between MRTF signature and the immune cell signatures. A MRTF gene signature correlates with a Th2 cell gene signature in the PDA TCGA dataset.

