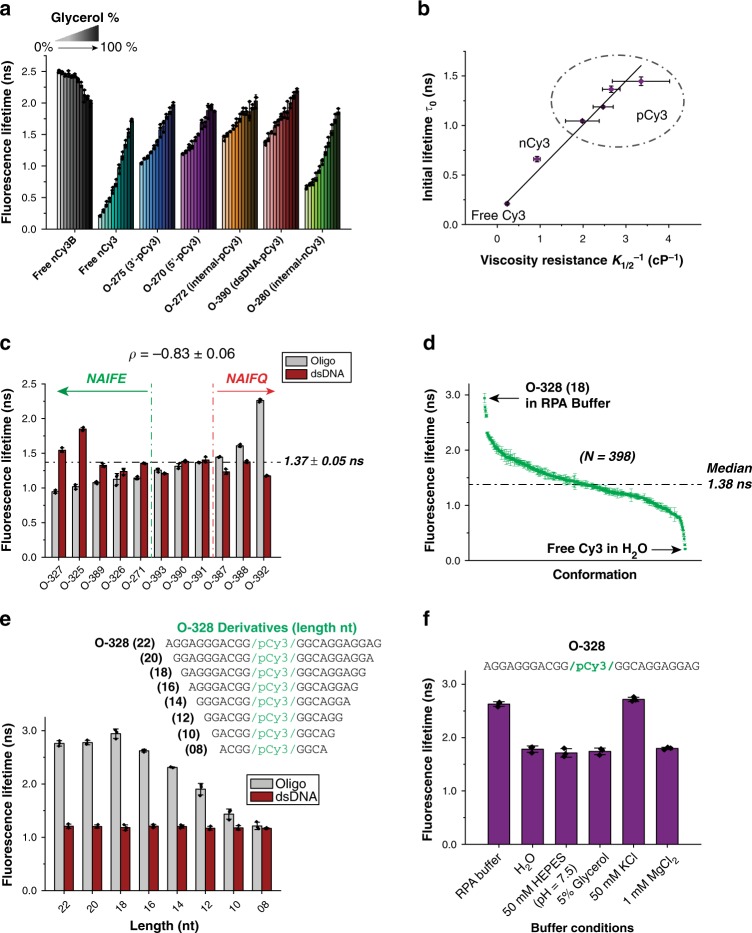
Fig. 4.
Insights into the structural properties of the DNA–Dye complexes. a Effect of viscosity on fluorescence; bar charts represent the fluorescence lifetimes of different fluorophores (free or DNA–Dye complexes), at increasing concentrations of glycerol (0–100%), in 10% increments. b Dependence of the fluorescence lifetime, without glycerol, on the viscosity resistance. The plot shows a linear dependence with slope of 0.44 ± 0.02 ns cP and y-intercept of 0.13 ± 0.04 ns. The horizontal error bars represent the standard error of the mean. The goodness of the linear fit, R2 value, is 0.989. c Fluorescence lifetimes of 11 internal-pCy3-labeled oligo library with different sequences (gray) and their corresponding dsDNA (red). The horizontal dashed line shows the average fluorescence lifetime of dsDNA in this library. The green vertical dashed line delimits oligos that show an overall NAIFE effect, upon annealing of their complementary strand, whereas the red vertical dashed line delimits those showing an overall NAIFQ effect. The Pearson coefficient of the correlation between the initial fluorescence lifetime (ssDNA) and the fluorescence change (%), upon annealing the complementary oligo, is reported with its respective standard error. d Fluorescence lifetime landscape of Cy3 compiling all the Cy3 lifetimes measured in this study (N = 398). The horizontal dashed line represents the median value of the landscape. e Bar chart indicating the fluorescence lifetime of O-328 and its derivatives, in ssDNA (gray) and dsDNA (black) forms, measured in RPA buffer. f Bar chart indicating the fluorescence lifetime of O-328 in ssDNA form, in different individual RPA buffer components. Error bars represent SD from three replicates and ± represent SEM. Oligo sequences are listed in Supplementary Table 1

