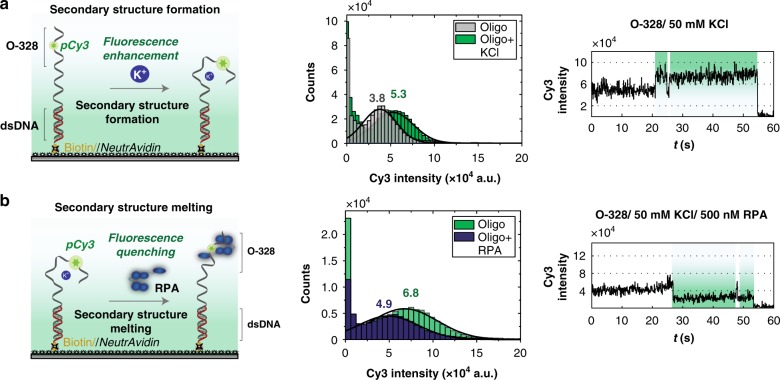
Fig. 6.
DNA structural changes monitored using Cy3 fluorescence modulation. a Secondary structure formation. Left: schematic showing the experimental set-up. Upon the addition of K+, a secondary structure is formed leading to an enhancement of Cy3 fluorescence. Middle: Cy3 fluorescence intensity histograms with (green) K+. The histograms are fitted to Gaussian distributions. Right: representative single-molecule trace showing the transitions to the enhanced-fluorescence state, upon formation of the secondary structure, as a result of the binding of K+. b Melting of the secondary structure. Left: schematic drawing showing the DNA construct used in c with a secondary structure formed in the presence of K+. However, upon addition of RPA, this secondary structure is melted, leading to the quenching of Cy3′s fluorescence. Middle: Intensity histograms of the Cy3 fluorescence, in the absence (green) and presence (blue) of RPA. Histograms are fitted with Gaussian distributions. Right: representative single-molecule trace showing the transitions to the quenched-fluorescence state, upon melting of the secondary structure induced by the binding of RPA measurements for a and b were recorded with 100 ms temporal resolution

