Fig. 3.
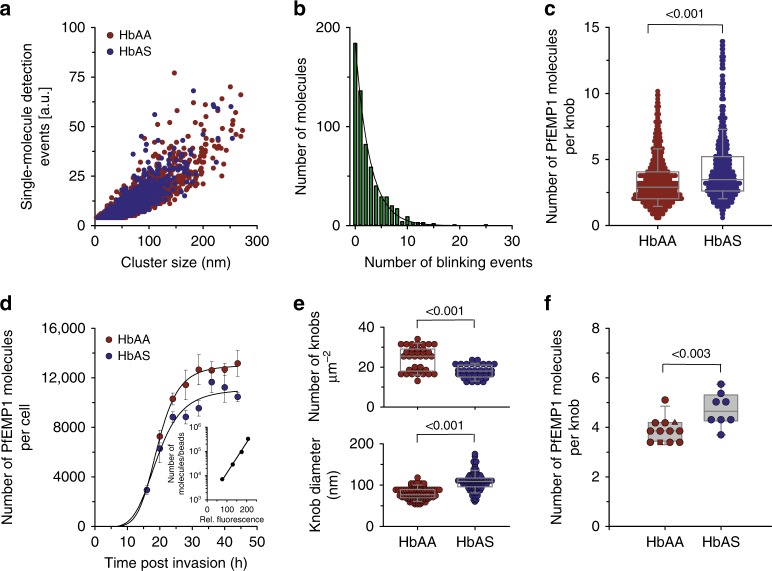
A quantitative framework for assessing the number of PfEMP1 molecules per knob. a Single-molecule detection events are shown as a function of the fluorescence cluster size for the G6 strain grown in HbAA (dark red dots) and HbAS (dark blue dots) erythrocytes25. b Calibration curve showing the blinking distribution curve of single mEOS2 molecules immobilized on a glass surface25. A single exponential decay function was fitted to the data points. c Number of PfEMP1 molecules per knob for G6 at the trophozoite stage grown in HbAA and HbAS erythrocytes, as determined by PALM. A total of 771 and 638 knobs, respectively, were analyzed25. A box plot analysis is overlaid over the individual data points, with the median and the 25 and 75% quartile ranges being shown (also in the following subfigures). Statistical significance was assessed using the Mann–Whitney rank sum test (also in the following subfigure). d Absolute number of surface-presented PfEMP1 molecules (VAR2CSA variant) per single erythrocyte infected with the parental FCR3CSA strain as a function the time post invasion, as determined by quantitative FACS analysis using the Zenon-labeled monoclonal antibody PAM 8.1 directed against VAR2CSA. The mean ± SEM are shown for n = 4 or more independent biological samples / blood donors25. Red and blue circles, FCR3CSA grown in HbAA and HbAS erythrocytes respectively. The insert shows a representative calibration curve to convert fluorescence signals into absolute molecule numbers. e Knob density and knob diameter for HbAA and HbAS erythrocytes infected with FCR3CSA (trophozoites), as determined by scanning electron microscopy25. Data are derived from x = three independent biological samples / blood donors. f Number of PfEMP1 molecules per knob for FCR3CSA grown in HbAA (red) and HbAS (blue) erythrocytes, as determined by quantitative FACS analysis and taking into account cell surface area and knob density25. Each data point corresponds to an independent biological sample based on a different blood donor. The following anti-VAR2CSA monoclonal antibodies were used: PAM 8.1 (red circles), PAM 3.1 (red triangle), PAM 4.7 (red square)

