Fig. 4.
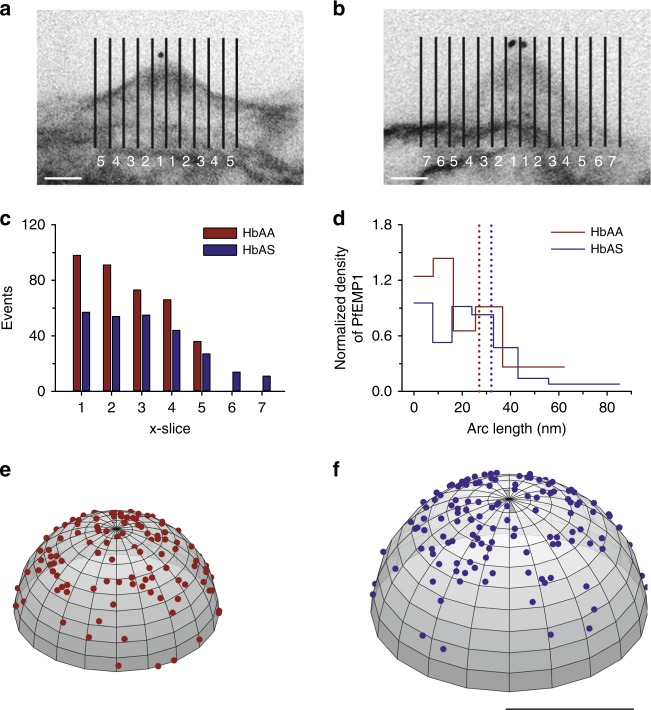
Spatial arrangement of PfEMP1 molecules on knobs. a, b Representative electron micrographic images of knobs from HbAA a and HbAS b erythrocytes infected with FCR3CSA, labelled with the VAR2CSA specific monoclonal antibody PAM 8.1 as a primary antibody and, as a secondary antibody, a goat anti human antibody coupled to 10 nm protein A gold. For stereological analysis, the micrographic images were divided in sections of 8 nm each and the sections were numbered from the center of the knobs outward. Bar, 20 nm. c Number of gold grains per section25. d Distribution of PfEMP1 molecules on knobs as a function of the arc length (from center to periphery), assuming knobs have a hemispherical shape34. The dotted lines indicate the position of the average radial extension of the VAR2CSAmEOS2-derived fluorescence signal, as reference points. e, f A spatial probability distribution model showing the predicted location of 120 and 150 PfEMP1 molecules on an idealized hemispherical knob from infected HbAA e and HbAS f erythrocytes, respectively34. The model takes into account the different knob size in infected HbAA and HbAS erythrocytes. Bar, 50 nm

