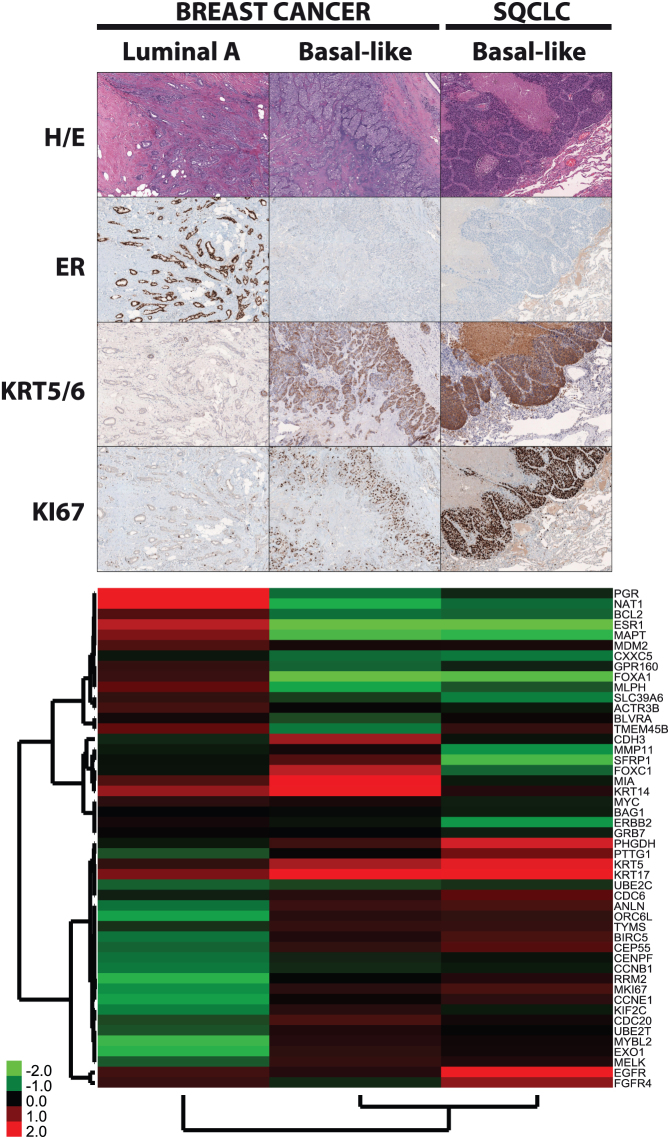
Figure 4. Immunohistochemical (IHC) and PAM50 gene expression analyses of a Basal-like breast cancer, a SQCLC with a Basal-like profile and a Luminal A breast cancer.
Hematoxylin/eosine (H/E); Estrogen receptor (ER) expression; Keratin 5/6 (KRT5/6) expression; Proliferation-related Ki-67 expression. Each colored square on the heatmap below the IHC images represents the relative transcript abundance (in log2 space) of each PAM50 gene with highest expression being red, lowest expression being green and average expression being black.

