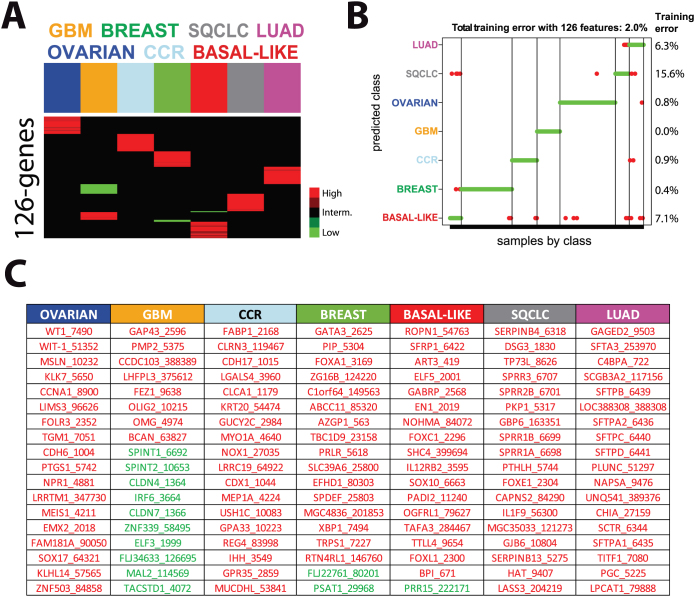
Figure 5. Identification of a cancer type-specific 126-gene signature.
(A) Clustering of the 126-gene scores obtained after Classification by Nearest Centroids (ClaNC) analysis. Discriminative genes are shown in red and in green color. (B) Training error of the 126-gene signature across the 7 cancer-types. (C) Genes whose high (red) or low (green) expression define each cancer type. Gene Symbols are shown first, followed by the Entrez GeneIDs.

