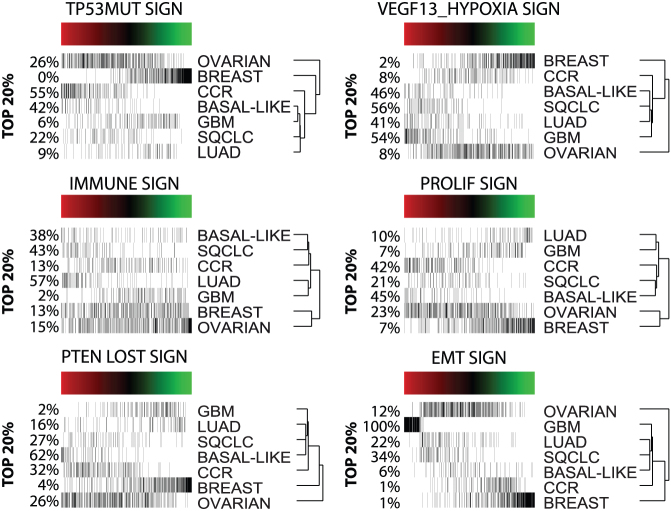
Figure 8. Expression of 6 selected gene signatures (SIGN) representing various cancer-related biological processes in the unified dataset.
For each gene signature, samples have been rank ordered based on their gene signature score (red, black and green represent above, equal and below the median score). Samples from each cancer type are shown below the gene signature score heatmap. Percentages of samples present in the top 20% expressers in the entire dataset are shown on the left. PROLIF, proliferation; EMT, epithelial to mesenchymal transition; TP53MUT, P53 mutation.

