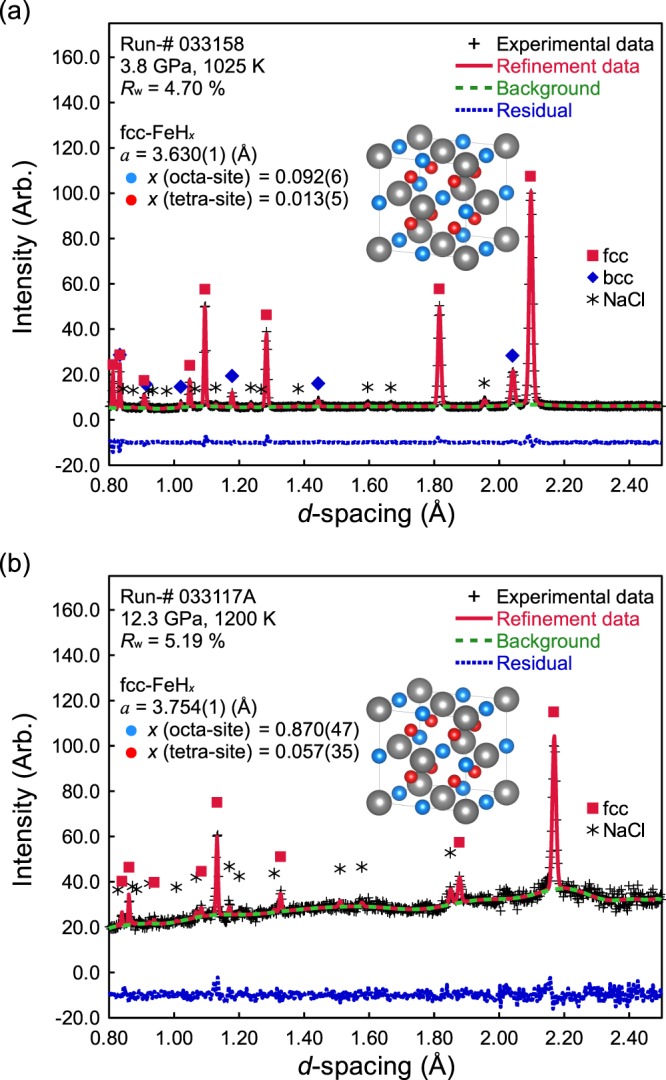
Figure 3.

Typical experimental profiles and fitting results of Rietveld refinement for fcc FeHx. The black + signs represent the neutron diffraction profile obtained experimentally. The red solid line represents refined profiles calculated from Rietveld refinement for fcc FeHx (and bcc Fe) with NaCl capsule. The green dashed line represents the background of neutron diffraction profile obtained experimentally. The blue dotted line represents the differences between experimental and refined profiles by an offset of −10 in the vertical axis for clarity. Colored symbols indicate the characteristic peaks of each observed phase (red squares: fcc FeHx, blue diamonds: bcc Fe, black asterisks: NaCl). The inset figure shows the crystal structure of fcc FeHx (the crystal symmetry is cubic (Fm-3m, Z = 4)) and the atomic sites of Fe are 4a (0, 0, 0), O-sites of fcc FeHx are 4b (1/2, 1/2, 1/2), and T-sites of fcc FeHx are 8c (1/4, 1/4, 1/4). Gray balls represent the Fe atom, light blue balls represent an O-site, and light red balls represent a T-site. The experimental conditions and fitting parameters of Rietveld refinement are given in the figures.
