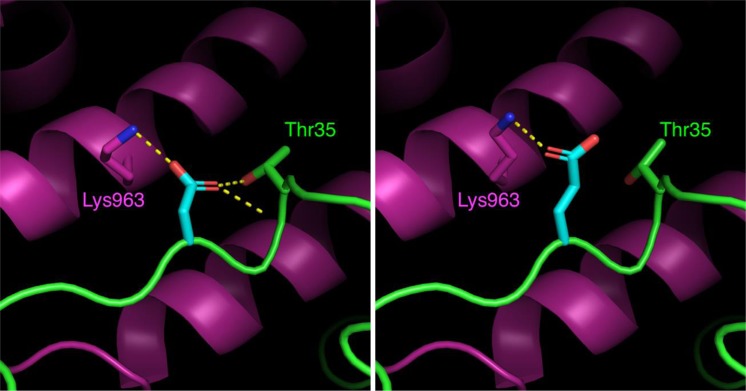
Figure 2.
Close-up view of a section of the interface between Ras (green) and SOS (magenta) at the “catalytic” Ras-binding site of SOS26, with Ras residue 33 shown in cyan. Hydrogen bonds are calculated using PyMOL and shown as dashed yellow lines. The left panel shows the wild-type Asp33 residue and the right panel shows the model of Asp33Glu. The mutation causes a change in the hydrogen bonding pattern at this site. Modelling this variant at the “distal” Ras-binding site of SOS shows a similar pattern of change in the hydrogen bonding pattern. No significant interatomic clashes are created.

