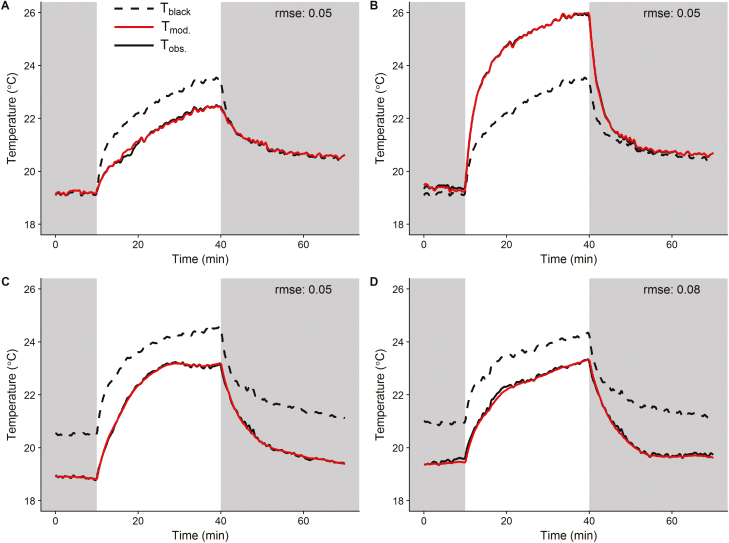
Fig. 3.
Temperatures of the reference materials and leaf replica observed (solid black line) and modelled (solid red line) in response to a step change in light intensity from dark to light (0–300 µmol m–2 s–1 at the site of the aluminium references and 0–430 µmol m–2 s–1 at the site of the leaf replica). Modelled temperatures were derived from the temperature kinetics of a black reference (Tblack, dashed black line). Observations described the temperature kinetics of (A) a white reference, (B) a dry leaf replica, and (C) and (D) a wet leaf replica. Parameter values were adjusted using Bayesian inference to minimize the error between observed and modelled data in (A), (B), and (C). Parameter values estimated in (C) were used to predict the temperature kinetics in (D) to test model predictions using an independent data set. The root mean square error (rmse) was calculated as an estimator of the quality of the model outputs.

