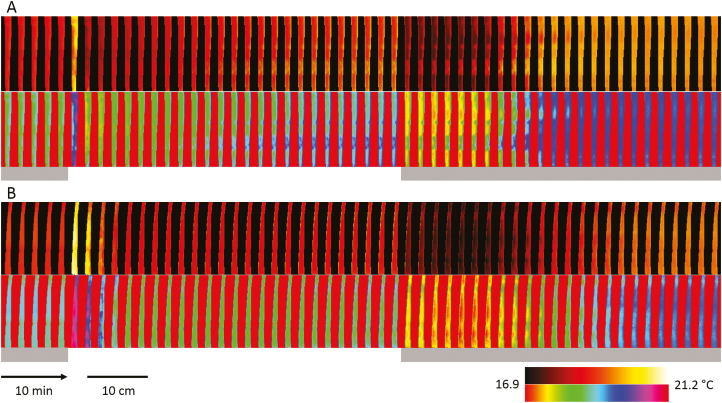
Fig. 4.
Time-series of thermal images displaying leaf temperature spatiotemporal differences for two leaves (A and B) subjected to changes in light intensities (grey background, 0 μmol m–2 s–1; white background, 430 μmol m–2 s–1). Two different colour scales are used to highlight either temperature kinetics or heterogeneity over the leaf surface. Average temperature kinetics for (A) leaf 4 and (B) leaf 5 are visible in Fig. 5

