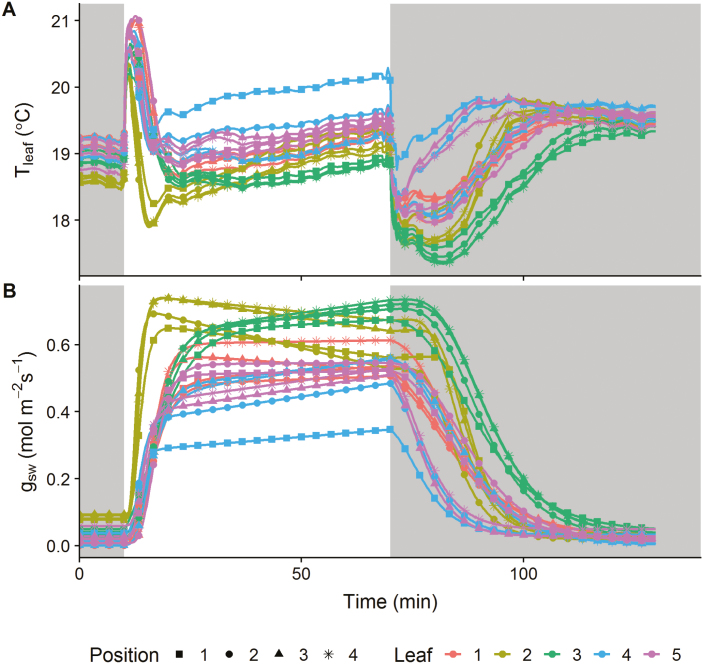
Fig. 5.
Spatial and temporal response of (A) leaf temperature (Tleaf) and (B) stomatal conductance (gsw) to step changes in light intensity. Dark areas represent a period where light intensity was 0 µmol m–2 s–1 and the white area a period where light intensity was 430 µmol m–2 s–1. Each colour represents a leaf, and each curve represents a different leaf position.

