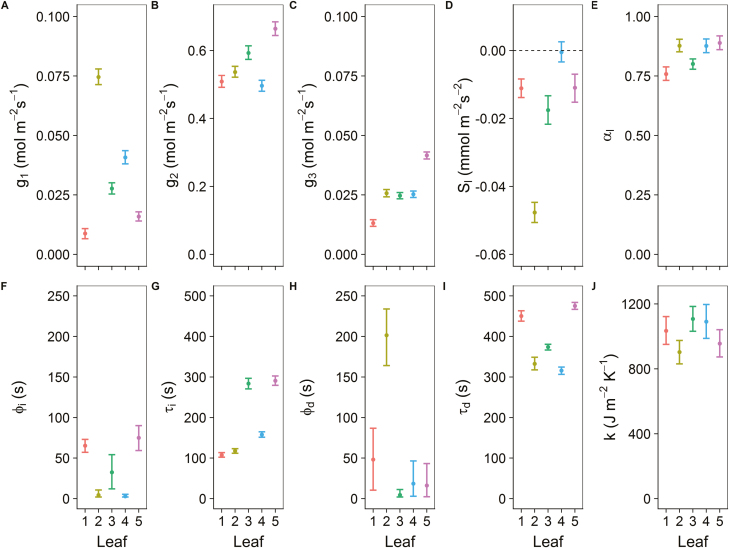
Fig. 8.
Parameter values (A–J) derived from the leaf energy balance model using Bayesian inference. Steady-state target for the stomatal conductance to water vapour (gsw) (A) during the initial dark period (g1), (B) the light period (g2), and (C) the final dark period (g3). (D) The slow increase or decrease in gsw over time (sl), with the dotted line representing 0. (E) The leaf shortwave absorbance (αl). The time lag and the time constant for (F and G) an increase (ϕi and τi) and (H and I) a decrease (ϕd and τd) in gsw. (J) The amount of energy per unit area required to change the temperature of the material by 1 °K (k). The model was fitted on observations from five leaves. Error bars represent the 95% credible interval. Colours represent the different leaf areas.

