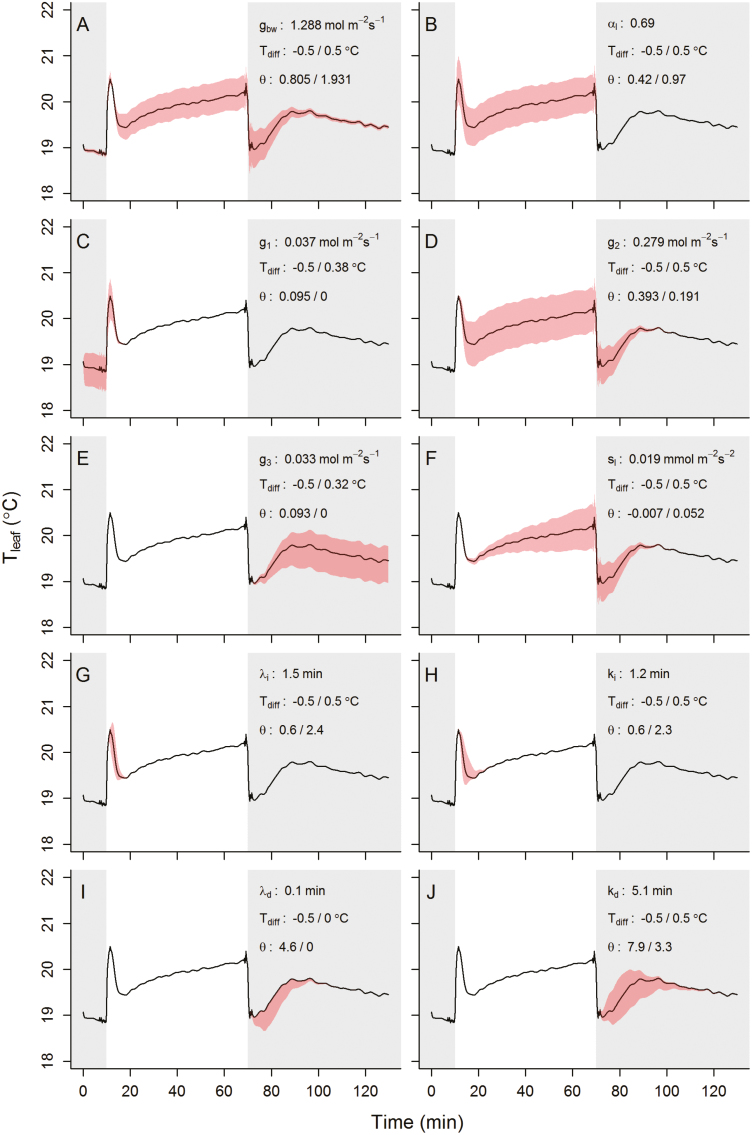
Fig. 9.
Sensitivity analysis representing the variation of parameter values required to change leaf temperature by ±0.5 °C during step changes of light intensity. Parameter values from leaf 2 and area 1 were used as an illustration (Fig. 5). Dark areas represent a period where light intensity was 0 µmol m–2 s–1 and the white area a period where light intensity was 430 µmol m–2 s–1. Differences in leaf temperature were only achieved over parts of the temperature kinetics depending on the parameter (red shaded area) and reached during these periods a maximum of ±0.5 °C. Original parameter values and corresponding curves (solid black line) are displayed in each plot, with the achieved temperature differences (Tdiff) and the corresponding parameter values (θ). In some cases (C, E, F, G, I), the maximum temperature deviation of ±0.5 °C was not reached due to a parameter value reaching a boundary (e.g. 0); the value achieved was shown instead of ±0.5 °C.

