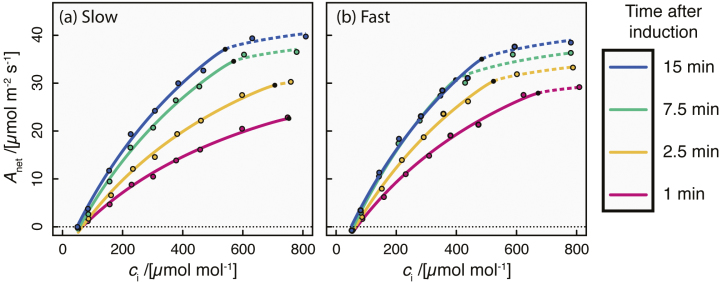
Fig. 1.
Two examples of dynamic A versus ci curves, for a leaf with relatively slow induction of photosynthesis to light (a; time for Vcmax to increase by 95% of the difference from its initial value to its final value, t95=12.5 min), and a leaf with faster induction (b; t95=5.8 min). In each panel, each curve comprises a Rubisco carboxylation-limited segment (solid lines) and an RuBP regeneration-limited segment (dashed lines), and four curves are shown, each corresponding to a different time after exposure to saturating PPFD (pink, 1 min; orange, 2.5 min; green, 7.5 min; blue, 15 min).

