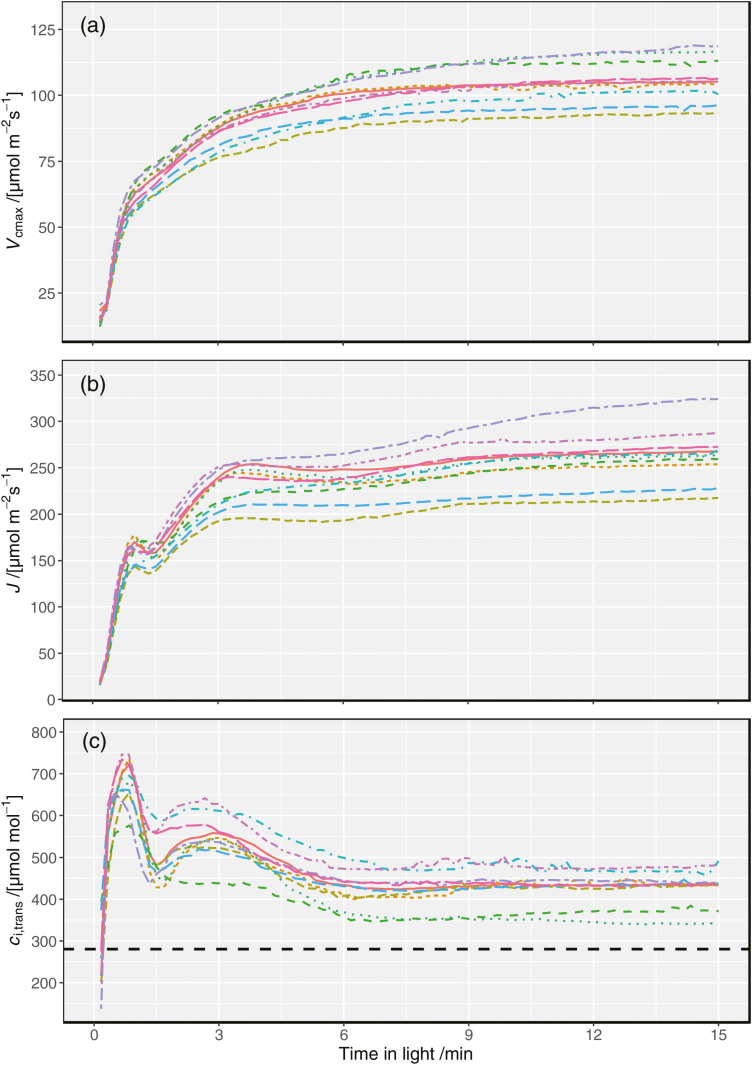
Fig. 2.
Kinetics of (a) the maximum Rubisco carboxylation rate (Vcmax), (b) the rate of electron transport (J), and (c) the value of ci at the transition point between Rubisco carboxylation limitation and RuBP regeneration limitation (ci,trans), based on dynamic A versus ci curves. Each color represents one of the 10 genotypes listed in Supplementary Table S2; lines and shaded regions indicate means ±SE for replicates within each genotype. In (c), the dashed horizontal line indicates a ci of 280 µmol mol–1, which corresponds to ci=0.7·ca at ca=400 µmol mol–1, which would be a typical operating ci for well-watered plants..

